3.7. Debug and Run a Project in Nuclei Studio VSCode
Nuclei Studio VSCode debugs projects through the CDT GDB Debug Adapter (the gdbtarget debugger type provided by the companion extension eclipse-cdt.cdt-gdb-vscode), connecting to the target through the GDB server of each debug scheme.
The debug configurations of a project are stored as Eclipse .launch files in the project folder (created by the project wizard from the NPK package), which are the source of truth for debugging. The launch.json file is regenerated automatically from them when a debug or run session starts. The project is always built before a session starts; if the build fails, the session is not started.
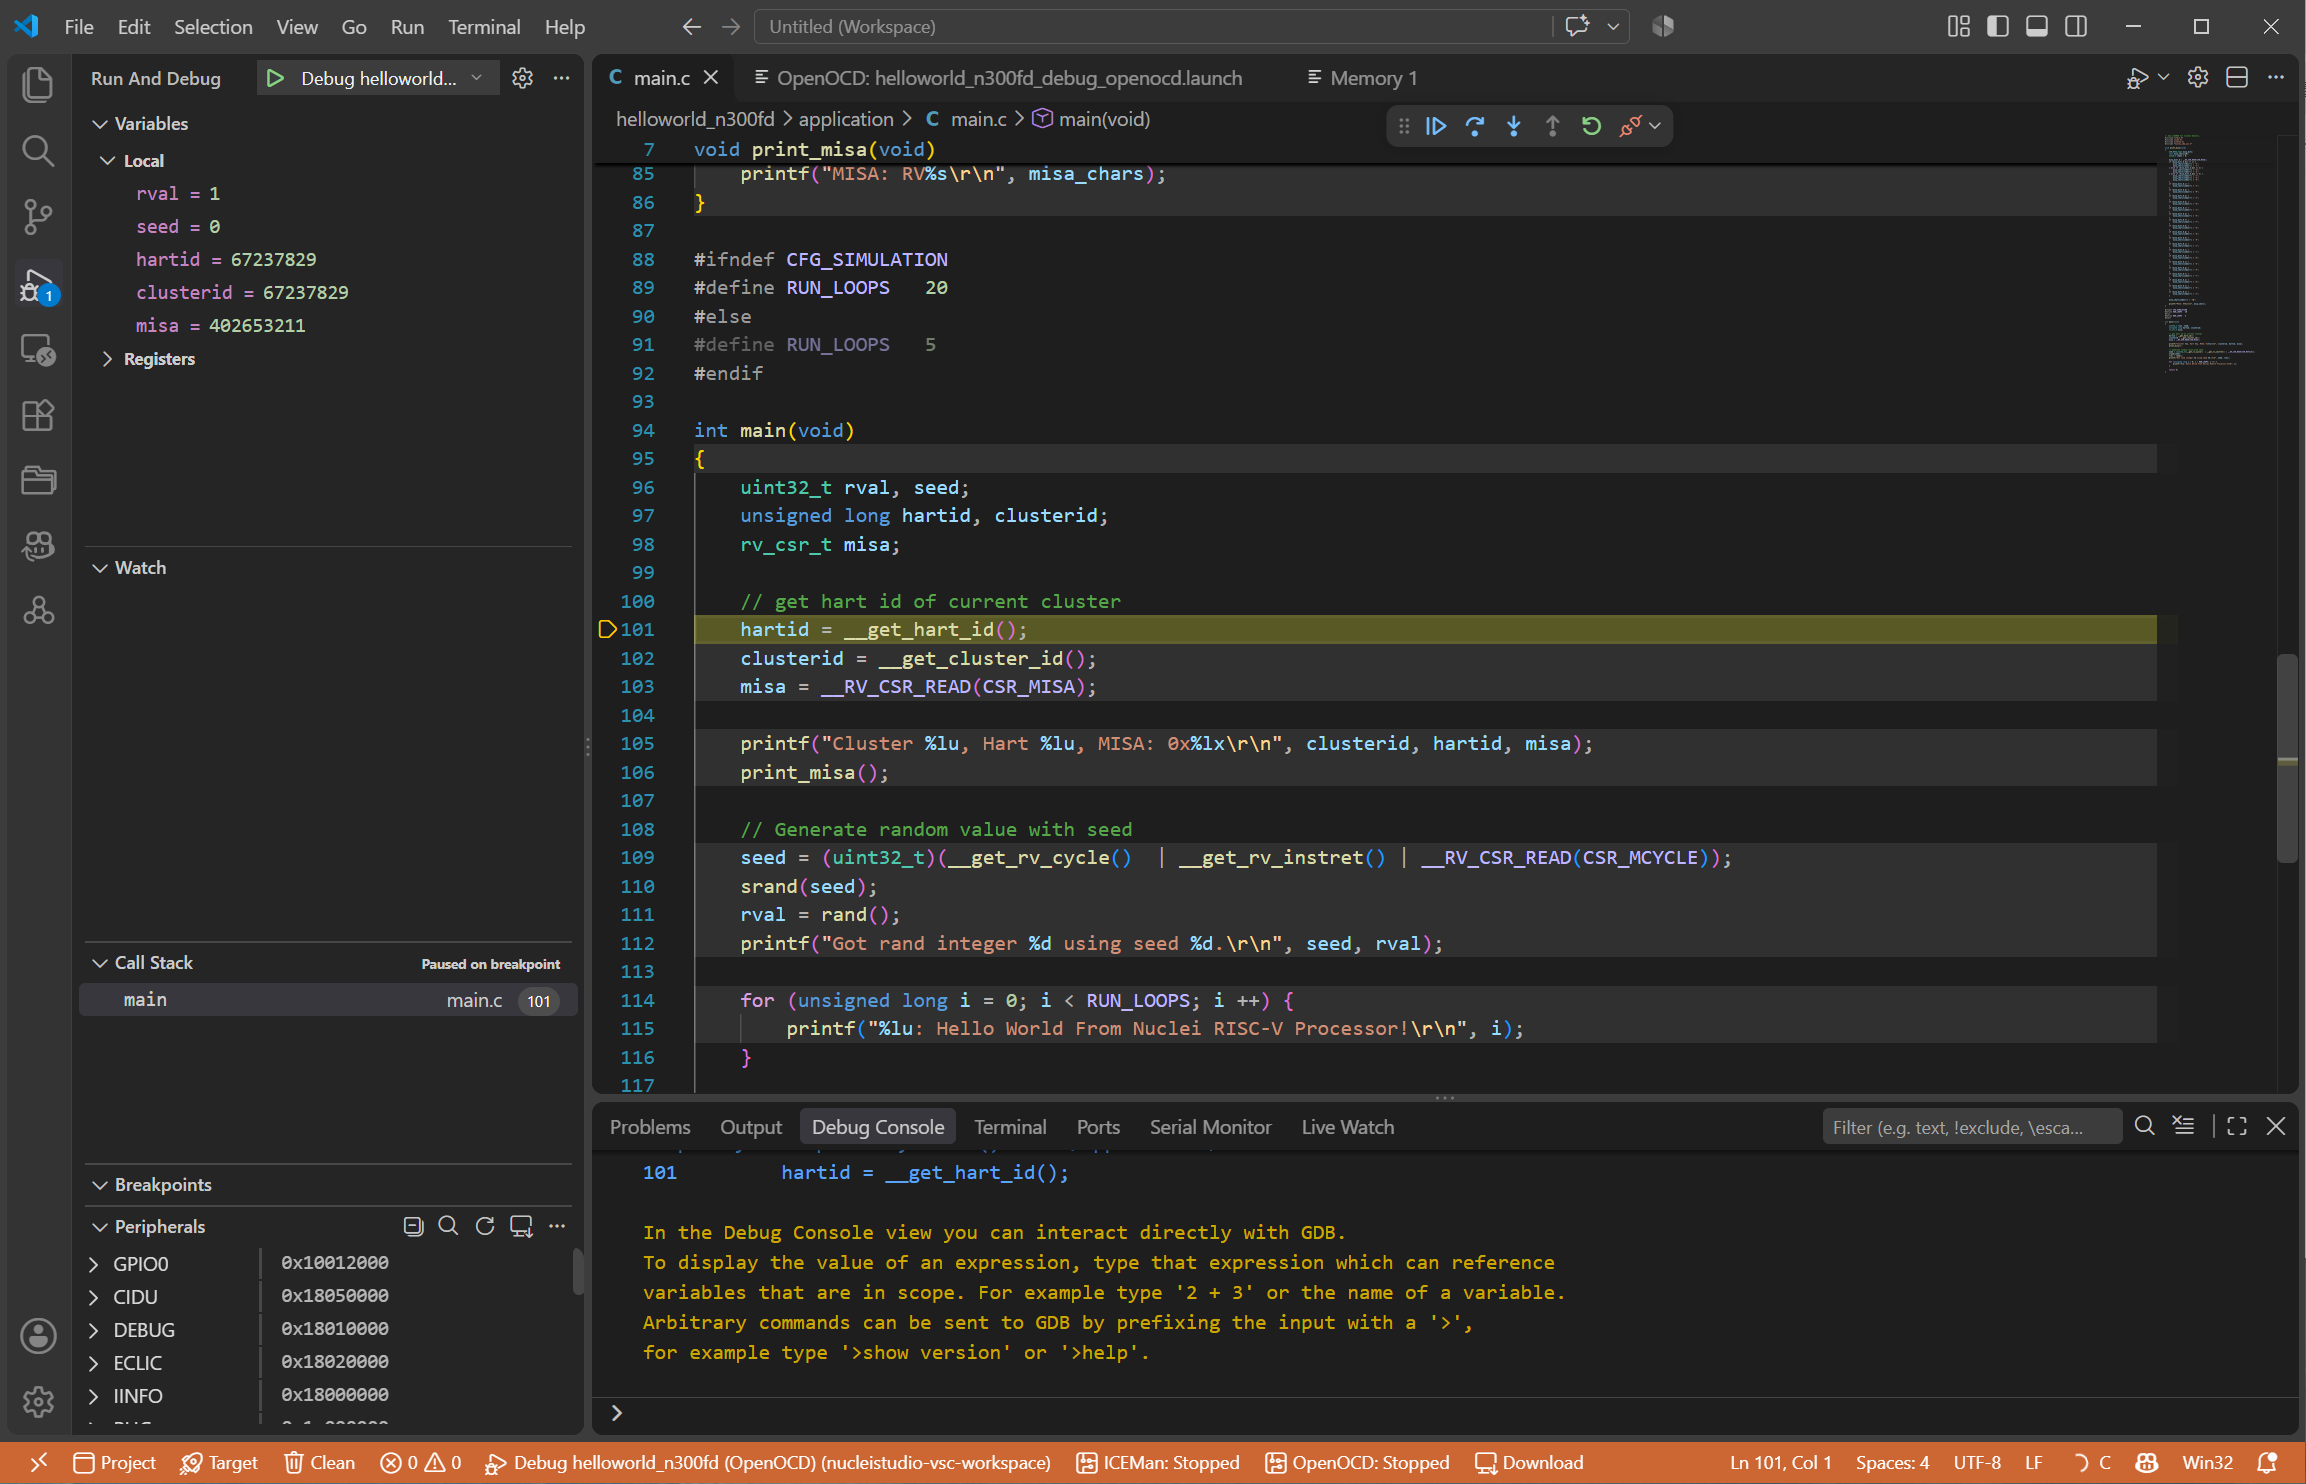
When a debug session starts, the Memory Inspector and the Peripheral Inspector are opened automatically, and the SVD file of the project is used for the peripheral register view.
3.7.1. Debug Schemes
The following debug schemes are supported:
Debug scheme |
Default GDB port |
Default server executable |
Notes |
|---|---|---|---|
OpenOCD |
|
|
Default telnet port 4444, Tcl port 6666; required by Live Watch |
J-Link |
|
|
Default SWO port 2332, telnet port 2333 |
QEMU |
|
|
Runs the program on the Nuclei EvalSoC simulation machine |
Nuclei Model |
|
|
Runs the program on the Nuclei Near Cycle Model; see Nuclei Model |
The locations of the servers are configured by the nucleiStudio.openocd_*, nucleiStudio.jlink_*, and nucleiStudio.nucleimodel_* settings, which are derived automatically from the Nuclei Studio IDE installation folder; see Configure the Nuclei Studio IDE Installation Folder.
3.7.2. Start Debugging
Make sure the intended project is the active project, then start debugging in one of the following ways:
Debug Project (command
Nuclei Studio: Debug Project, or pressF5): build the active project and start debugging with the debug scheme detected from its.launchfiles (OpenOCD by default). If there is nolaunch.json, a debug configuration is generated automatically from the project’s.launchfiles.Debug Project (Select Server): select a debug server (OpenOCD, J-Link, QEMU, and so on) manually;
.launchfiles that already exist in the project are marked with a check.Debug / Run in the project context menu: open the OpenOCD launch configuration editor of the project in debug or run mode.
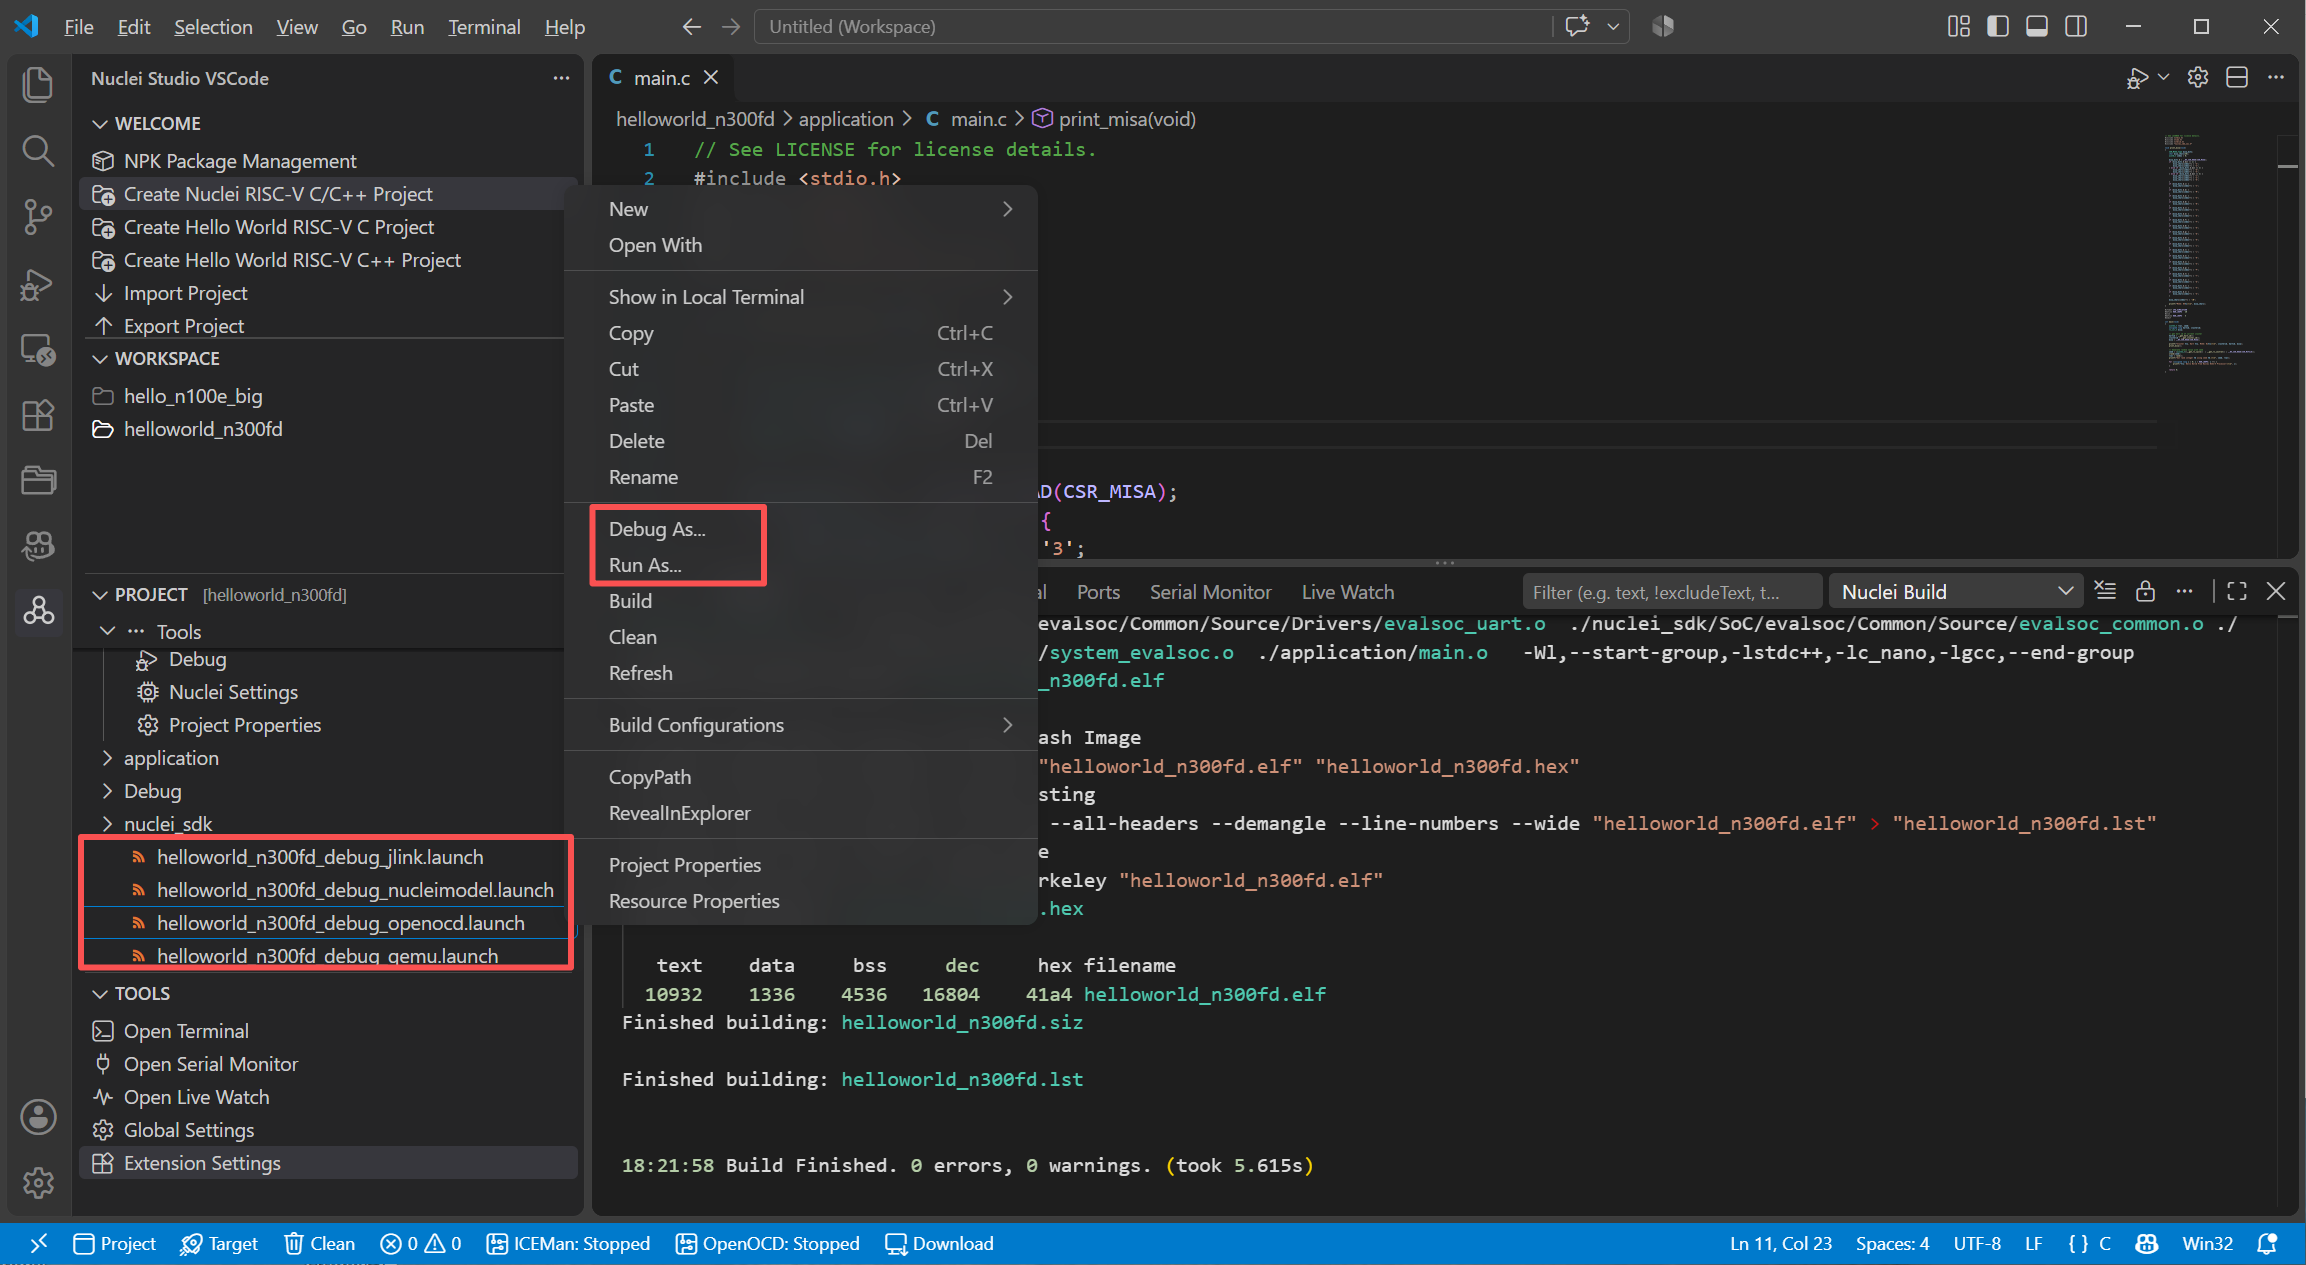
Debug As… / Run As… in the context menu of a
.launchfile in the PROJECT view: open the corresponding graphical launch configuration editor. Only OpenOCD, J-Link, QEMU, and Nuclei Model.launchfiles are supported.
3.7.3. Launch Configuration Editors
Graphical editors are provided for the OpenOCD, J-Link, QEMU, and Nuclei Model debug schemes. Opening a .launch file with Debug As... / Run As..., or using the Debug / Run actions of the project, opens the corresponding editor. The editors share the same layout, with Main, Debugger, Startup, and SVD Path tabs, and Save, Save and Start Debug (or Save and Start Run) buttons at the bottom. Changes are saved back into the .launch file.
Main: the project and the application (ELF) to debug, and the server startup options, such as starting the server locally or connecting to a running target, the executable path, ports, and additional server options. For QEMU and Nuclei Model, the simulation options are configured here, such as the board/machine name, the RISC-V core, the download mode (
ddr/flash/flashxip/ilm/sram), SMP count, vector length, and extra extensions.Debugger: GDB client setup (executable, options, commands) and remote target settings (host and port).
Startup: reset and load behavior, such as initial reset, load symbols and executable, debug in RAM, set breakpoint at
main, and continue.SVD Path: the SVD file used by the Peripheral Inspector.
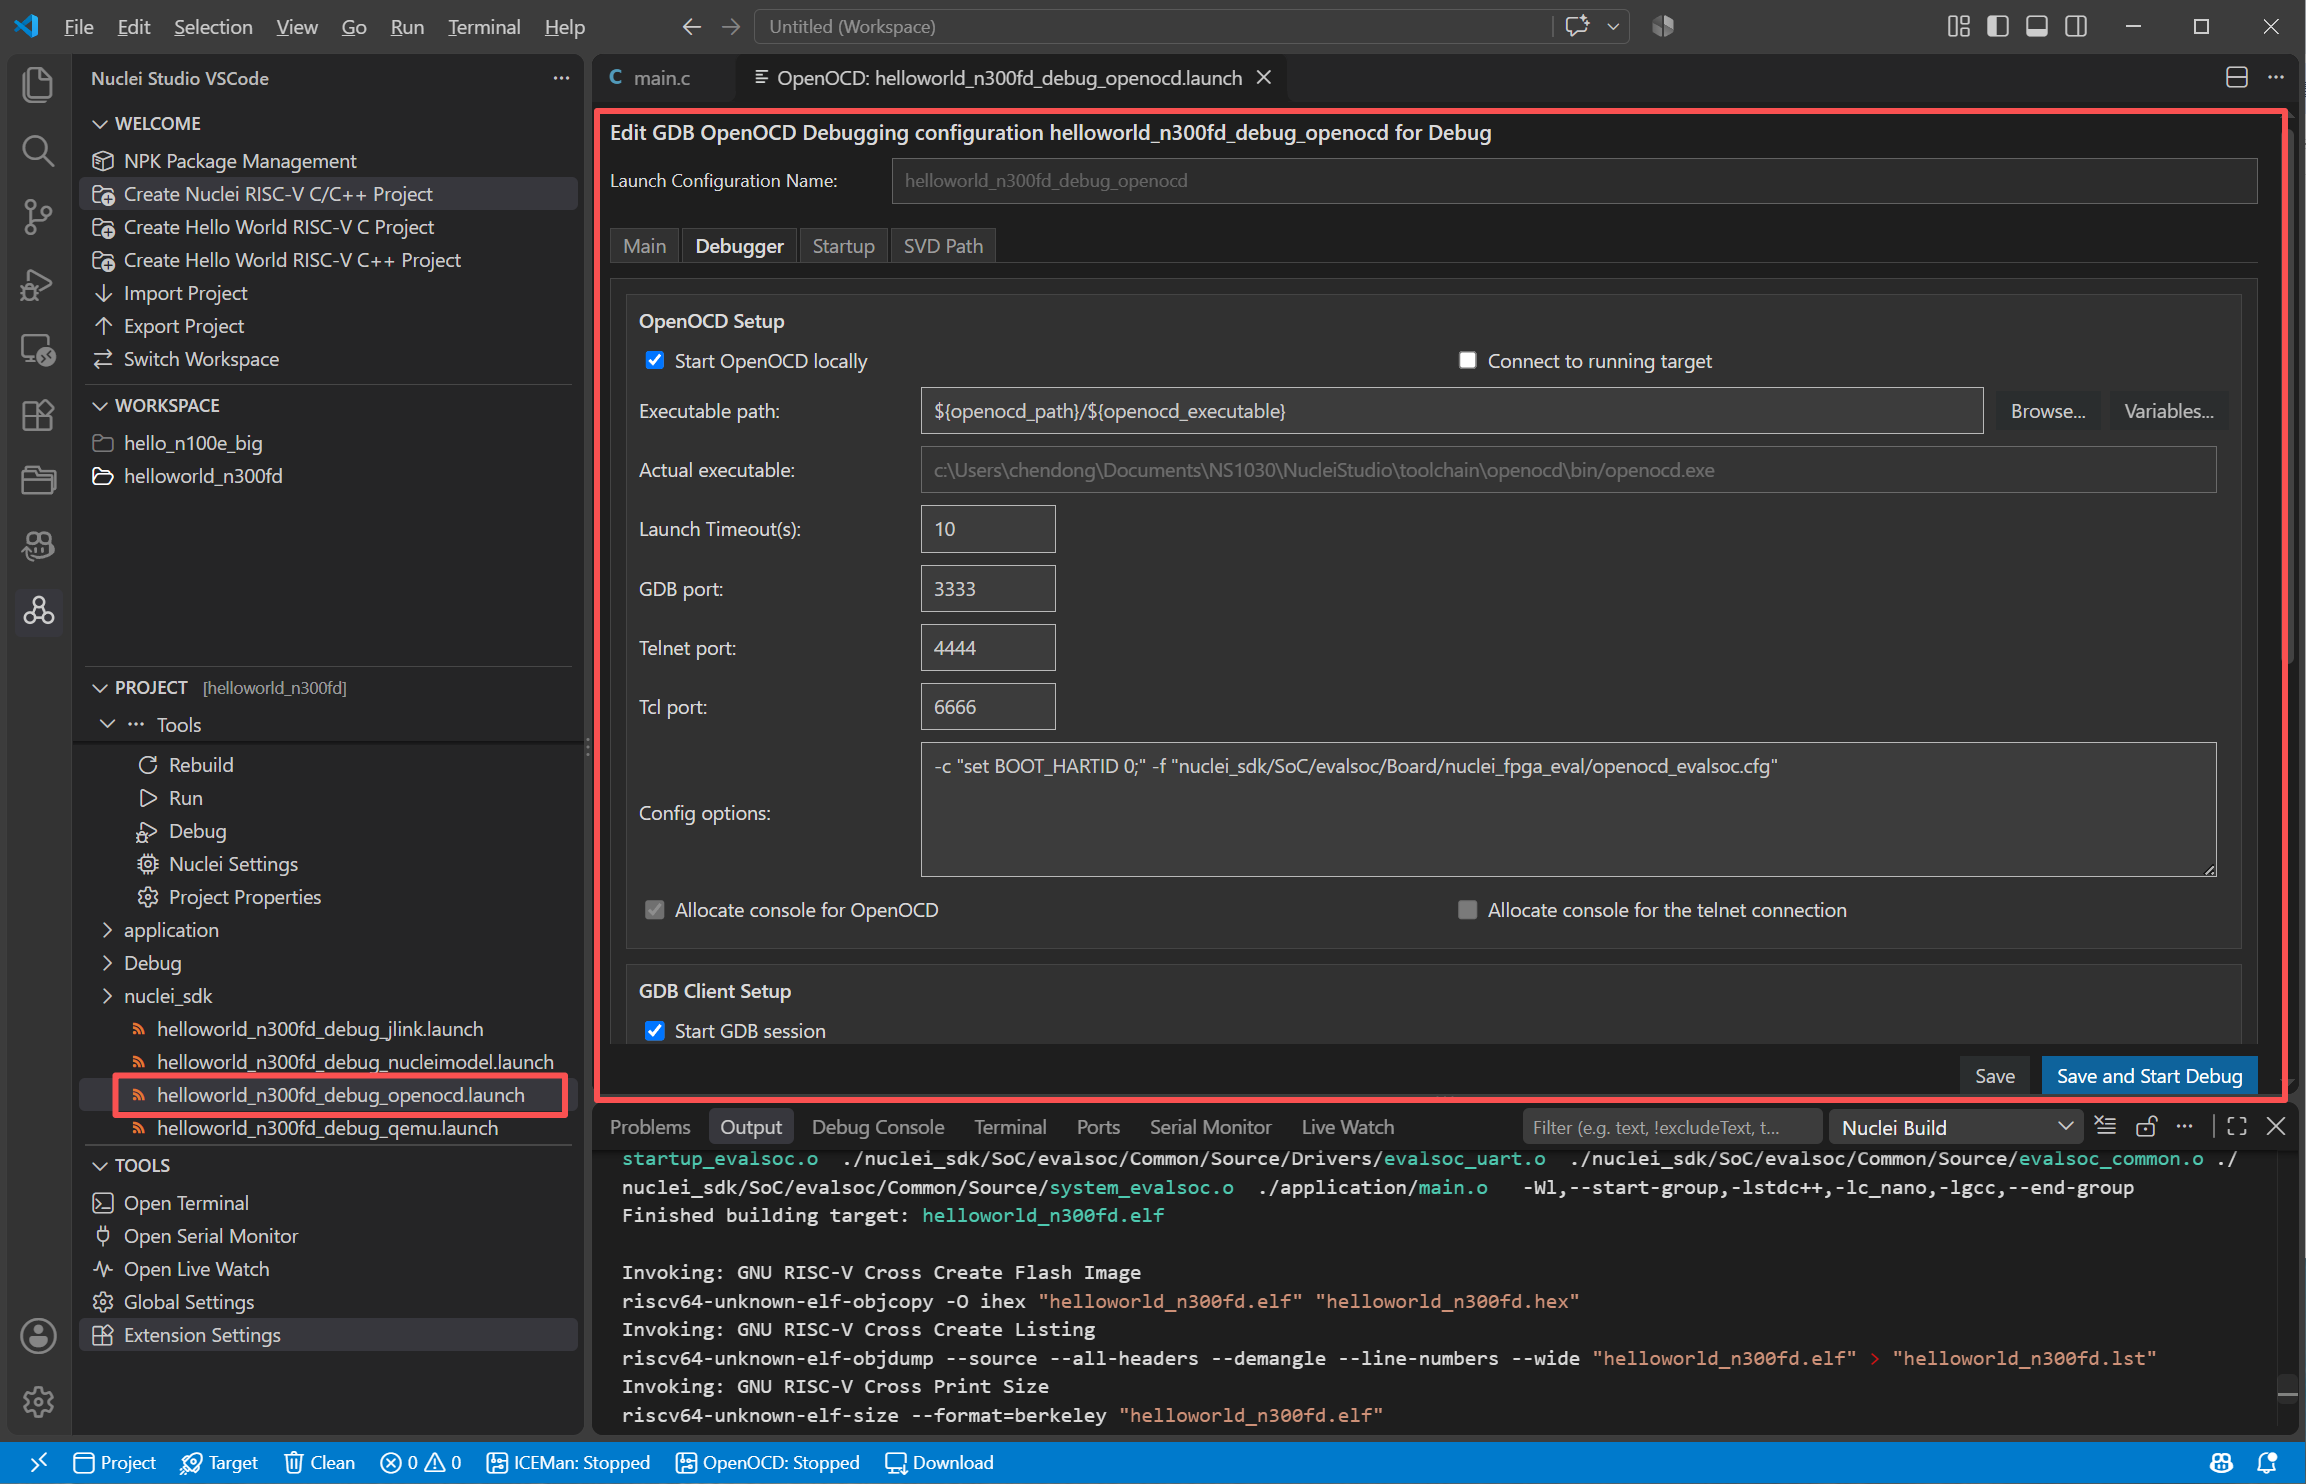
Take OpenOCD as an example: connect the target board, open the project’s <project>_debug_openocd.launch file, check the configuration, and click Save and Start Debug to start the debug session.
3.7.4. Run Without Debugging
The same schemes can also run the program without stopping at breakpoints: use Run in the project context menu or Run As... on a .launch file, which starts the session in run mode.
3.7.5. Serial Monitor and Debug Views
Serial Monitor: click
Open Serial Monitorin the TOOLS panel to open the Serial Monitor view provided by the companion extensionms-vscode.vscode-serial-monitorfor UART output of the board.Memory Inspector and Peripheral Inspector: opened automatically when a debug session starts, provided by the companion extensions
eclipse-cdt.memory-inspectorandeclipse-cdt.peripheral-inspector.
3.7.6. Limitations
QEMU ARM/AArch64 and Custom
.launchfiles can be used withF5/ Debug Project, but no graphical editor is provided for them.DLink debugging is only available when the project’s NPK package provides a DLink
.launchfile; there is no dedicated DLink editor.