2.9. Debugging and Running Projects in Nuclei Studio
Before debugging a project, first verify that the current hardware setup is correct; see Hardware check before debugging a project in Nuclei Studio.
2.9.1. Debug Mode Management
In Nuclei Studio, the Launch Bar manages different debuggers. By default, Nuclei Studio generates the corresponding *.launch debug files for OpenOCD, J-Link, and QEMU, and adds any detected *.launch file to the Launch Bar for management. You can switch between debug modes in the following three ways.
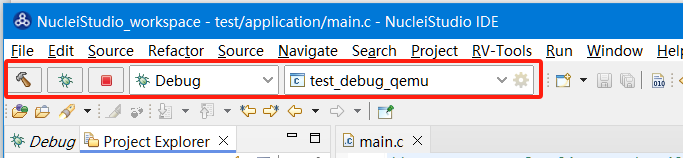
Click a *.launch file in the project to switch debug modes. Nuclei Studio sets the clicked file as the selected file in the Launch Bar; you can then perform Run/Debug operations from the Launch Bar.

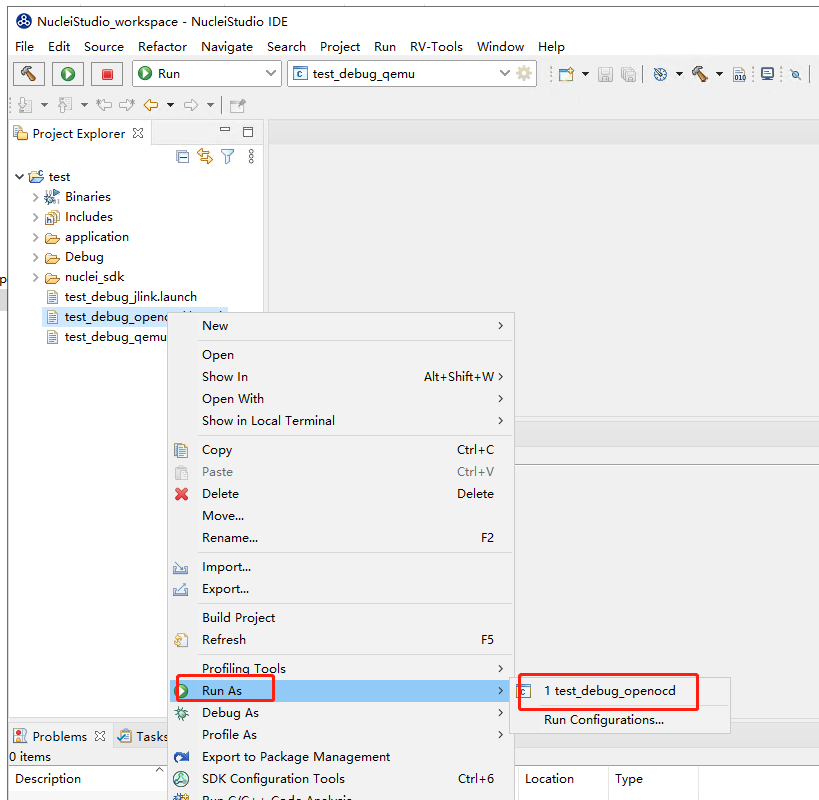
Expand the project, right-click the *.launch file, select Debug As/Run As from the context menu, and then click the corresponding mode in the submenu to start the Run/Debug operation.

You can also switch between debug modes through the drop-down box in the Launch Bar: click the expand button, select the corresponding debug mode, and perform the Run/Debug operation.

2.9.2. Debugging and Running a Project with the HummingBird Debugger and OpenOCD
2.9.2.1. Installing the HummingBird Debugger Driver
Note
Starting with version 2021.02, Nuclei Studio’s OpenOCD is driver-free on Windows. Windows users on this version or later can skip this section; Linux users must still configure the driver. Users on earlier versions must install the driver as described below.
2.9.2.1.1. Installing the Driver on Windows
Once the program builds successfully, it can be downloaded to the FPGA prototype board and run. First, connect the prototype board to the host PC as follows.
Plug one end of the HummingBird debugger into a USB port on the host PC and the other end into the prototype board. Because the HummingBird debugger also converts the UART output of the prototype board to USB, once the debugger is recognized by the host PC (that is, once the driver is installed successfully), the host detects it as a COM serial port. You can find the COM port number (for example, COM11) under the Ports (COM & LPT) category in the host PC’s Device Manager. This serial port serves as the printf output interface for the program running on the prototype board.
Note
If Windows on the host PC cannot recognize the HummingBird debugger’s USB connection, you need to install the driver. Download the driver from https://www.nucleisys.com/developboard.php#debuggerkit and install it.
Note
Before downloading through the HummingBird debugger, make sure it is correctly recognized by Windows: the HBird-Driver.exe driver must be installed as described in this section, and the COM port number must appear in Device Manager.
2.9.2.1.2. Installing the Driver on Linux
To install the driver on Linux:
1: Connect the development board to the Linux host and make sure the USB device is recognized. If you are using a virtual machine, make sure the board is connected to the virtual machine.

2: Run
lsusbin the console to view the device information; for example:
Bus 001 Device 010: ID 0403:6010 Future Technology Devices International, Ltd FT2232xxxx
3: In the console, run
sudo vi /etc/udev/rules.d/99-openocd.rulesto open the 99-openocd.rules file, enter the following content, then save and exit.
SUBSYSTEM=="usb", ATTR{idVendor}=="0403",

ATTR{idProduct}=="6010", MODE="664", GROUP="plugdev"

SUBSYSTEM=="tty", ATTRS{idVendor}=="0403",

ATTRS{idProduct}=="6010", MODE="664", GROUP="plugdev"
4: Disconnect the debugger and reconnect it.
5: Run
ls /dev/ttyUSB*to view thettyUSBinformation; for example:/dev/ttyUSB0 /dev/ttyUSB1
6: Run
ls -l /dev/ttyUSB1to view the group information; for example:crw-rw-r-- 1 root plugdev 188, 1 Nov 28 12:53 /dev/ttyUSB1
As shown,
ttyUSB1now belongs to theplugdevgroup. Next, add your user to theplugdevgroup (the group name may differ between environments; adjust it to your actual situation). Runwhoamito view the current user name, denoted below as<your_user_name>.
7: Run
sudo usermod -a -G plugdev <your_user_name>to add yourself to the plugdev group. You must reboot or log out for the change to take effect.8: Run
groupsto confirm that the current user belongs to theplugdevgroup. Ifplugdevappears in the output, the user was added successfully; otherwise, try rebooting.9: Check that all GCC dependencies are present. If any dependency is missing, run
sudo apt install libncursesw5 libtinfo5to install it.
cd NucleiStudio/toolchain/gcc/bin/

# for gcc10, try the command below
ldd ./riscv-nuclei-elf-gdb
# for gcc13/gcc14 and later versions
ldd ./riscv64-unknown-elf-gdb

2.9.2.2. Debug Configuration
2.9.2.2.1. Using the Debug Configuration Generated by Nuclei Studio
To simplify debugging, Nuclei Studio generates Debug Configuration launch files by default when a project is created, based on the Nuclei Package (NPK) configuration.
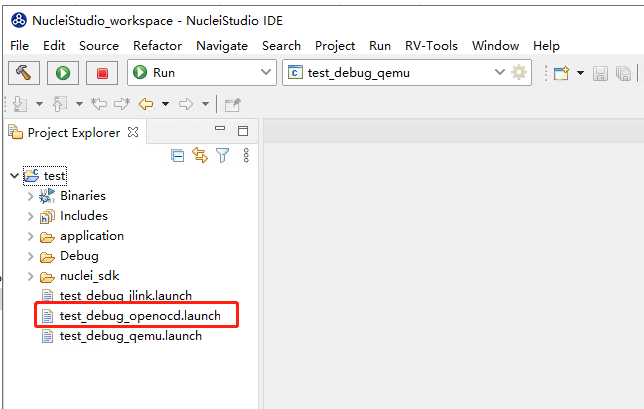
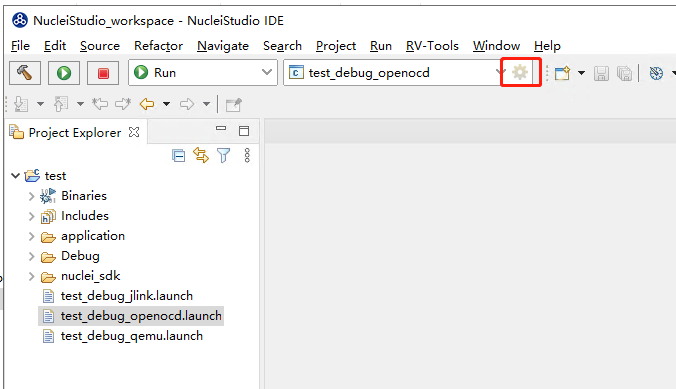
Expand the project, select the corresponding test_debug_openocd.launch file, and choose Run as/Debug as->test_debug_openocd from the right-click menu to run or debug the project with the corresponding Debug Configuration.
Note
The screenshots may not always be up to date, so figures and text may differ. In that case, follow the text and the behavior of your actual version.
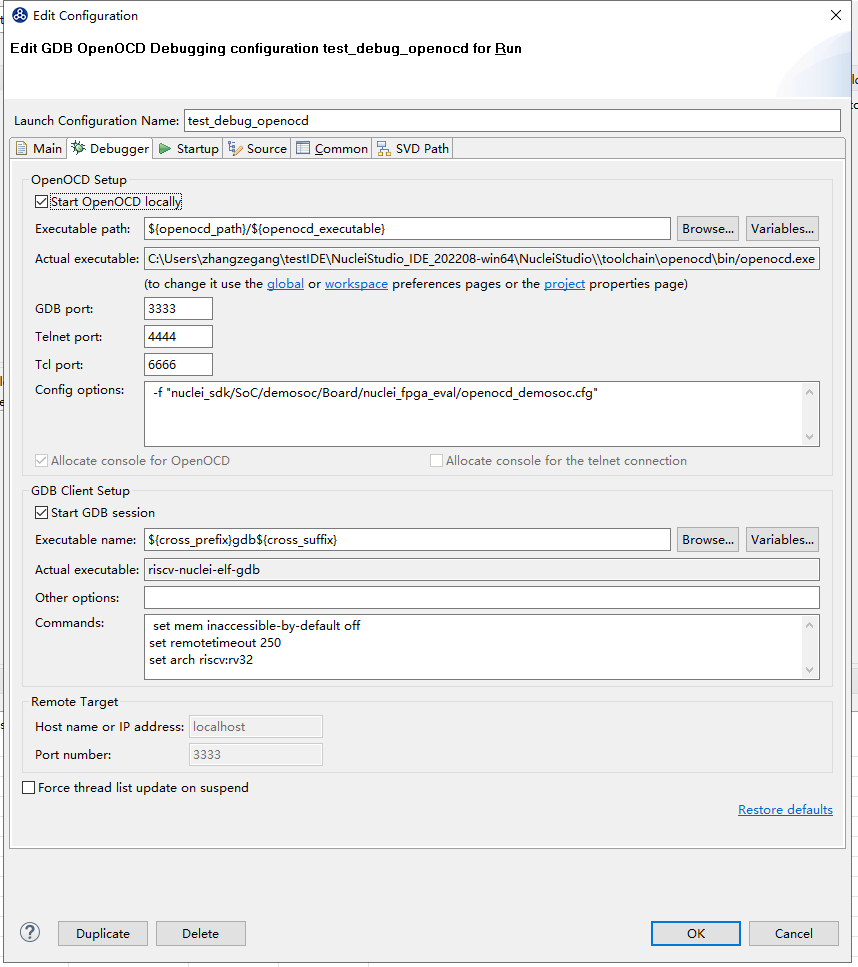
You can view the details of the Debug Configurations in the Launch Bar.
2.9.2.2.2. Creating and Configuring a Debug Configuration
To create and configure a Debug Configuration in Nuclei Studio:
In the Nuclei Studio main menu bar, select Run—>Debug Configurations.

In the dialog that opens, if there is no debug configuration for the current project, right-click GDB OpenOCD Debugging and select New to create a new debug configuration hello_world_demo Debug for the project.

Make sure Project is the project you want to debug, and that C/C++ Application points to the correct ELF file to debug.

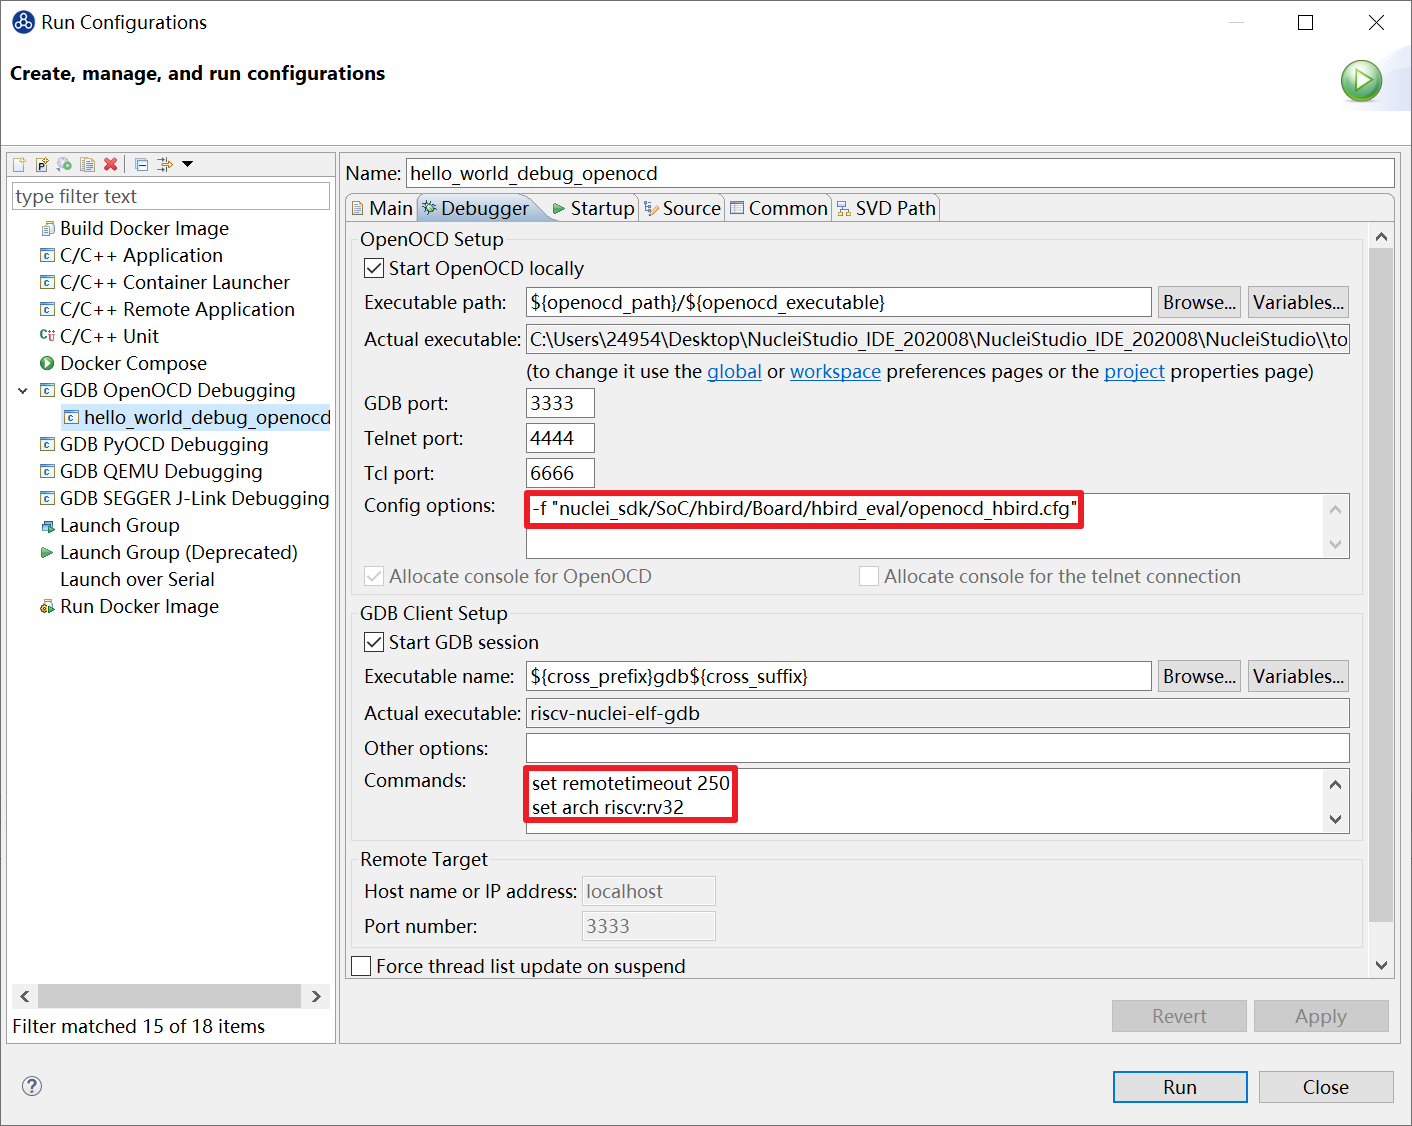
Select the Debugger tab of the debug configuration hello_world_demo Debug, and enter -f "nuclei_sdk/SoC/evalsoc/Board/nuclei_fpga_eval/openocd_evalsoc.cfg" in the Config options field so that OpenOCD uses the correct configuration file. The configuration file here (nuclei_sdk/SoC/evalsoc/Board/nuclei_fpga_eval/openocd_evalsoc.cfg) must match the actual OpenOCD configuration file path in your project. For example, if the project is imported using a Makefile, change the content here to -f "SoC/evalsoc/Board/nuclei_fpga_eval/openocd_evalsoc.cfg".
If the current core is a 32-bit RISC-V core, make sure the Commands field includes set arch riscv:rv32.
If the current core is 64-bit, use set arch riscv:rv64 instead.
Note
Launch Timeout is a new configuration option introduced in Nuclei Studio 2025.10. In some scenarios OpenOCD starts very slowly, and if Nuclei Studio does not detect the OpenOCD startup within the default 10 s, the launch times out. Use Launch Timeout to adjust the timeout period.
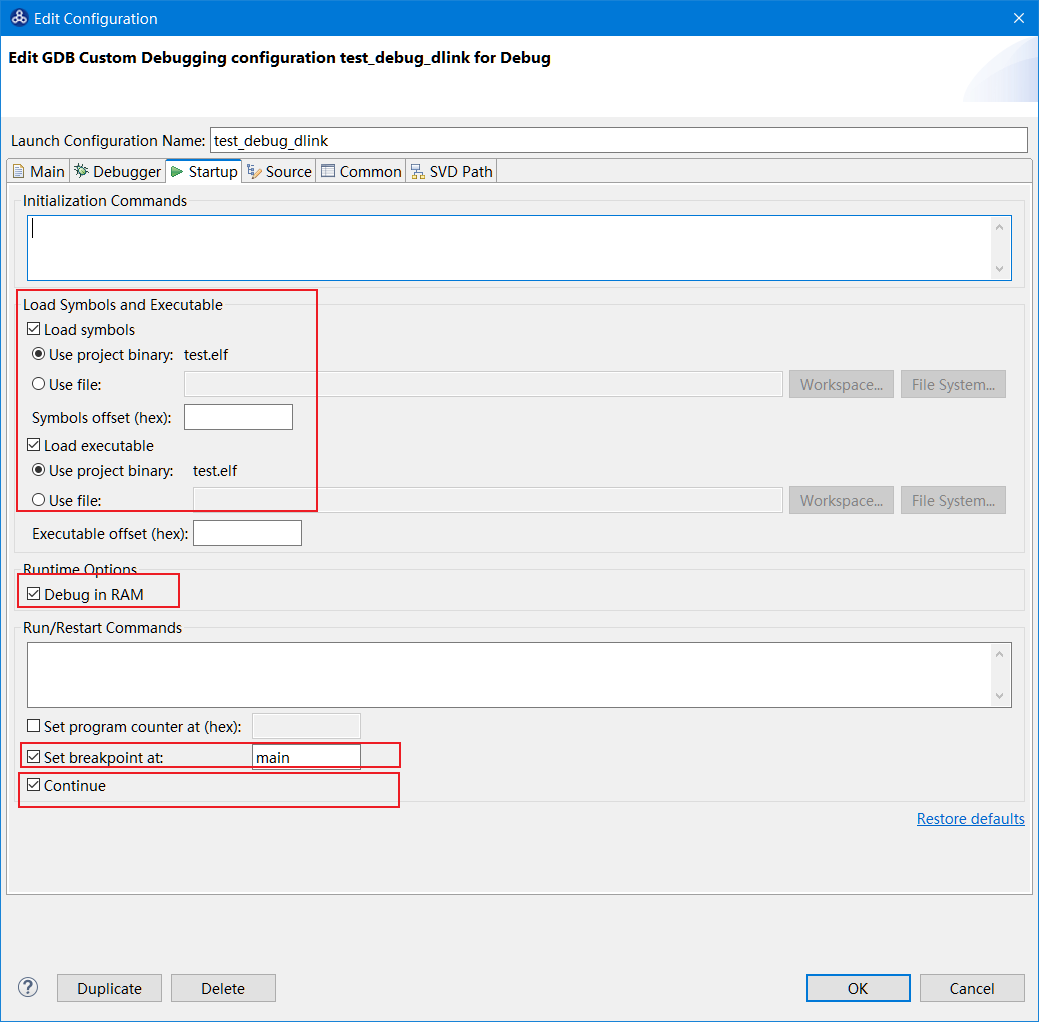
Select the Startup tab of the debug configuration hello_world_demo Debug, and make sure Debug in RAM, Pre-run/Restart reset, Set Breakpoint at Main, and Continue are checked.
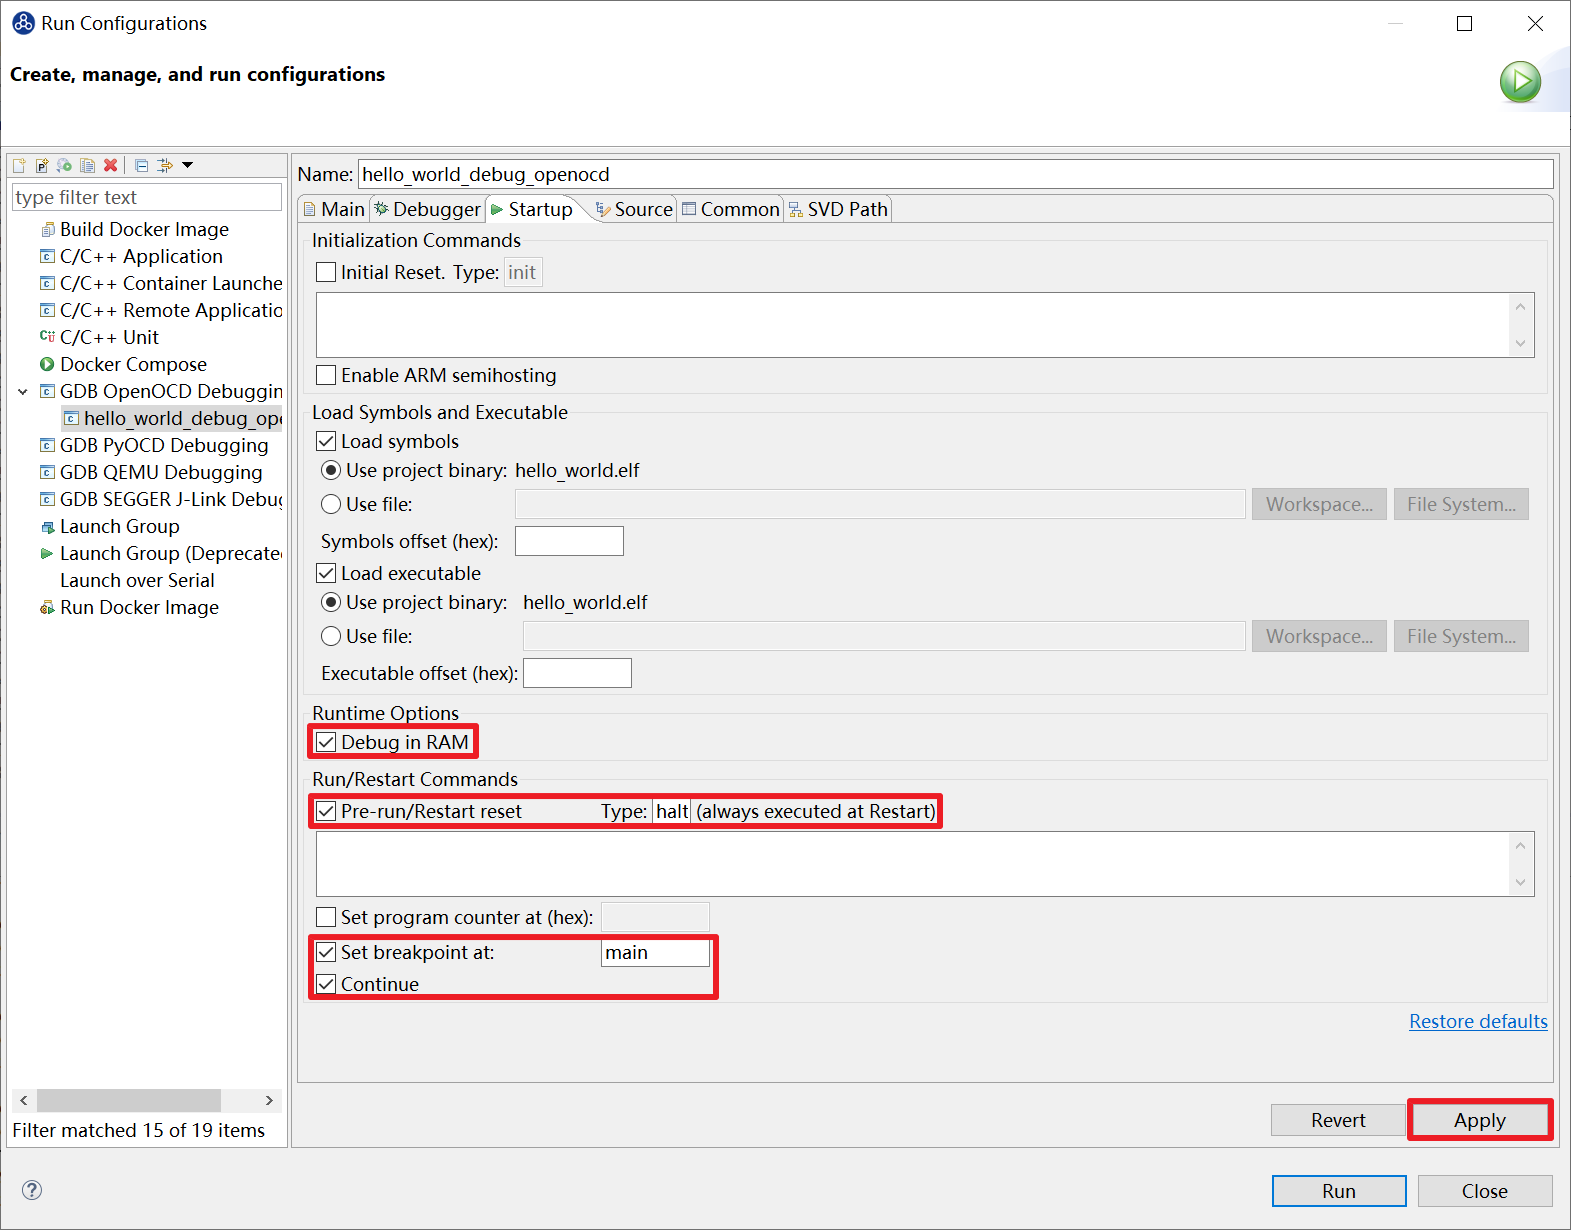
When the configuration is complete, click Apply at the bottom right to save the settings.
Each Startup setting in the Debug Configuration is described in detail below. These settings are ultimately implemented as GDB commands and are executed in the order listed.
The official Eclipse Embedded CDT documentation also provides a basic introduction to the Startup parameters; see https://eclipse-embed-cdt.github.io/debug/openocd/riscv/ for details.
Initial Reset
Specifies the commands GDB runs during initialization. See the usage of GDB init commands for details; this option generally does not need to be checked.
Enable Arm Semihosting
If you need to enable Semihosting during debugging, check this option; you can also add arm semihosting enable directly to the OpenOCD configuration file. For more details on project configuration and J-Link debugging, see:
Load symbols
Uses the GDB file command so that GDB reads the debug information from the ELF file, allowing GDB to debug correctly. Keep this option checked.
Load executable
Uses the GDB load command to download the program to the target: GDB downloads the ELF content to the target and sets the PC of the target CPU to the entry address of the current ELF. If you are debugging a program in RAM (such as LM), keep this option checked. If you are debugging a program in Flash, check whether OpenOCD supports Flash programming and whether the current debug session needs to reprogram the Flash: if both are true, check this option; otherwise, leave it unchecked. This option is not needed for ROM code.
Debug in Ram
If GDB performs actions such as reset after load executable, the CPU boot address may differ from the start address of the ELF file, or the program in RAM may be cleared by the reset. The ELF file must therefore be reloaded after each GDB reset. If you are debugging a program in RAM, this option must be checked.
Pre-run/Reset
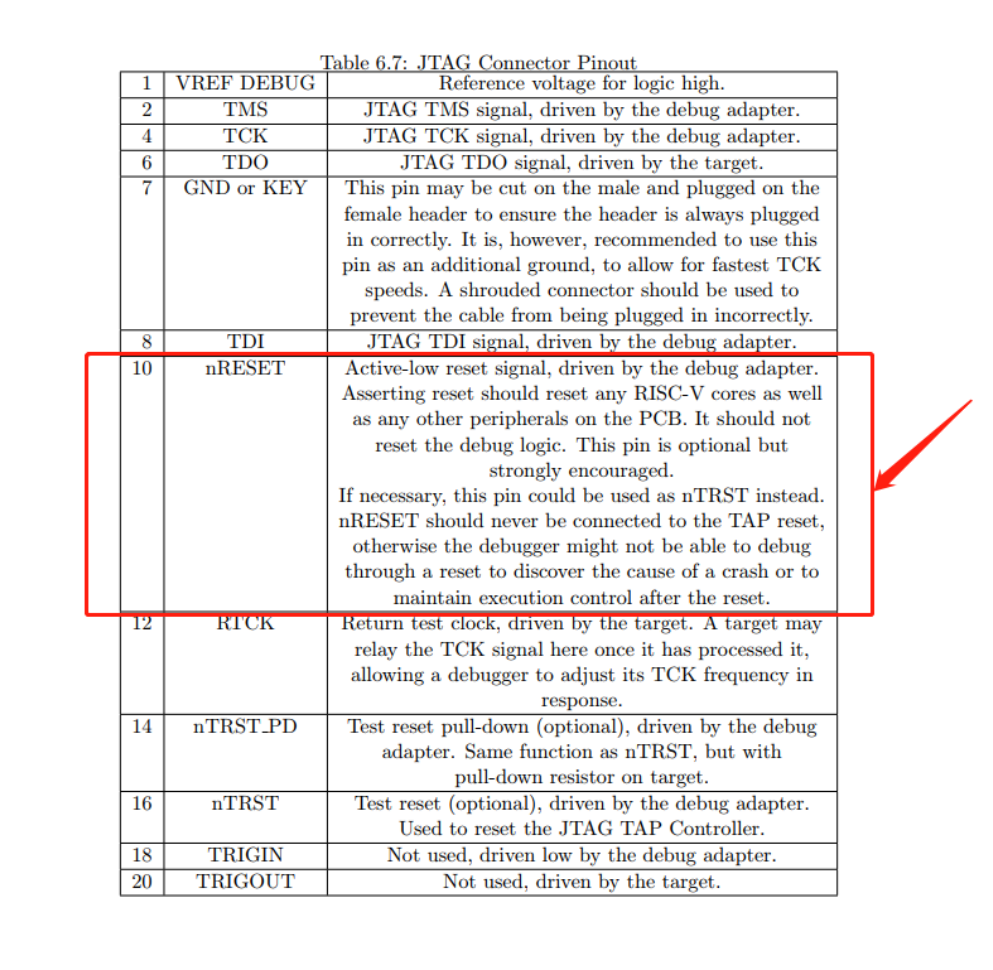
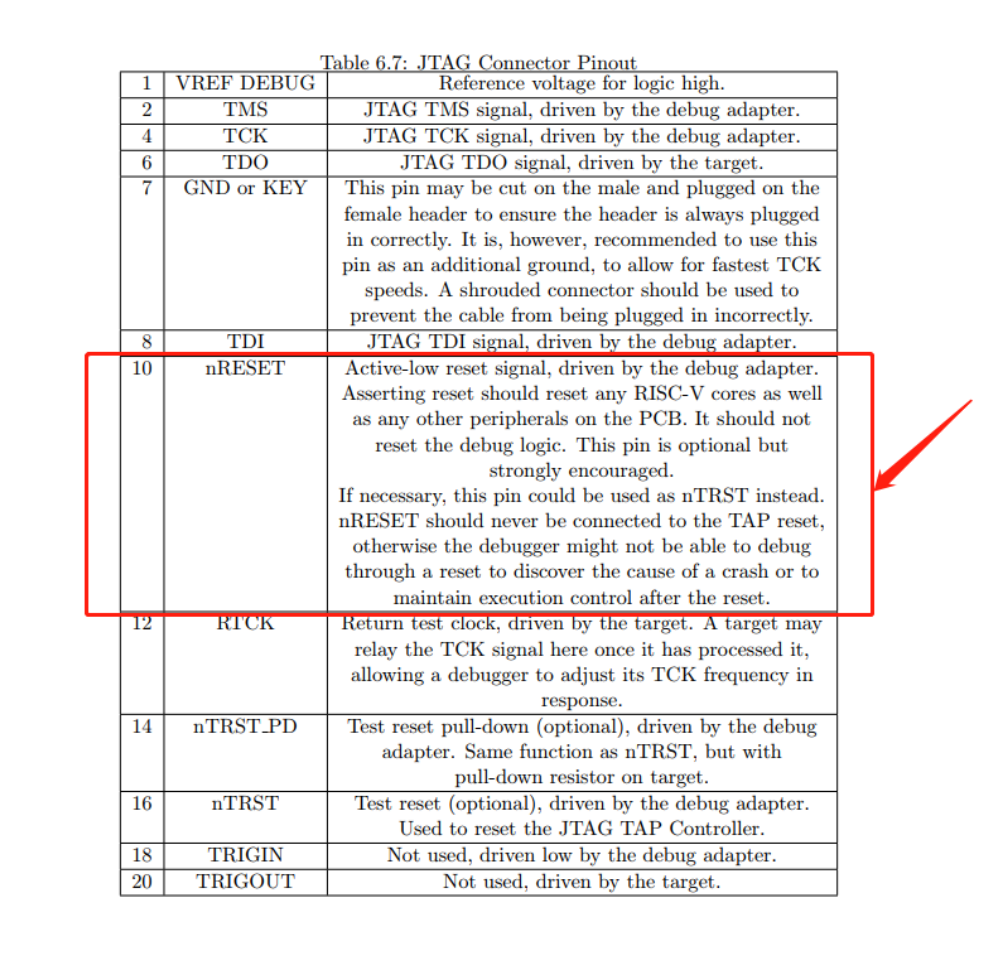
Uses the GDB monitor reset command, which sends a reset command to OpenOCD. OpenOCD drives the nReset signal according to the RISC-V Debug Spec, and this signal resets both the core and the peripherals (this also depends on the specific implementation, but the RISC-V Debug Spec recommends this behavior, and Nuclei’s example SoCs and FPGA implementations follow this spec). After reset is executed, the CPU’s PC is the reset_vector address, and because all peripherals are reset, the RAM content is also cleared. If you are debugging in RAM and this option is checked, the Debug in RAM option must also be checked.
The following figure shows the description of nRESET in the RISC-V Debug Spec.
Halt
Uses the GDB monitor halt command, which sends a halt command through OpenOCD after the reset command, so that the CPU halts immediately after reset.
Set Program counter at
Uses the GDB set $pc command to set the PC of the target CPU.
Set breakpoint at
Uses the GDB break command. The default is the main function; for a first debug session or when debugging startup code, change it to something else, such as _start or an absolute address.
Continue
Uses the GDB continue command.
2.9.2.3. Debugging the Program on the Prototype Board
Before debugging on the development board, you need to open the serial port to observe the printf output.
To open the serial port on Windows:
Open the serial terminal built into Nuclei Studio: select Window>Show View>Terminal, and, as shown in the figure, click the monitor icon to open the serial port settings.
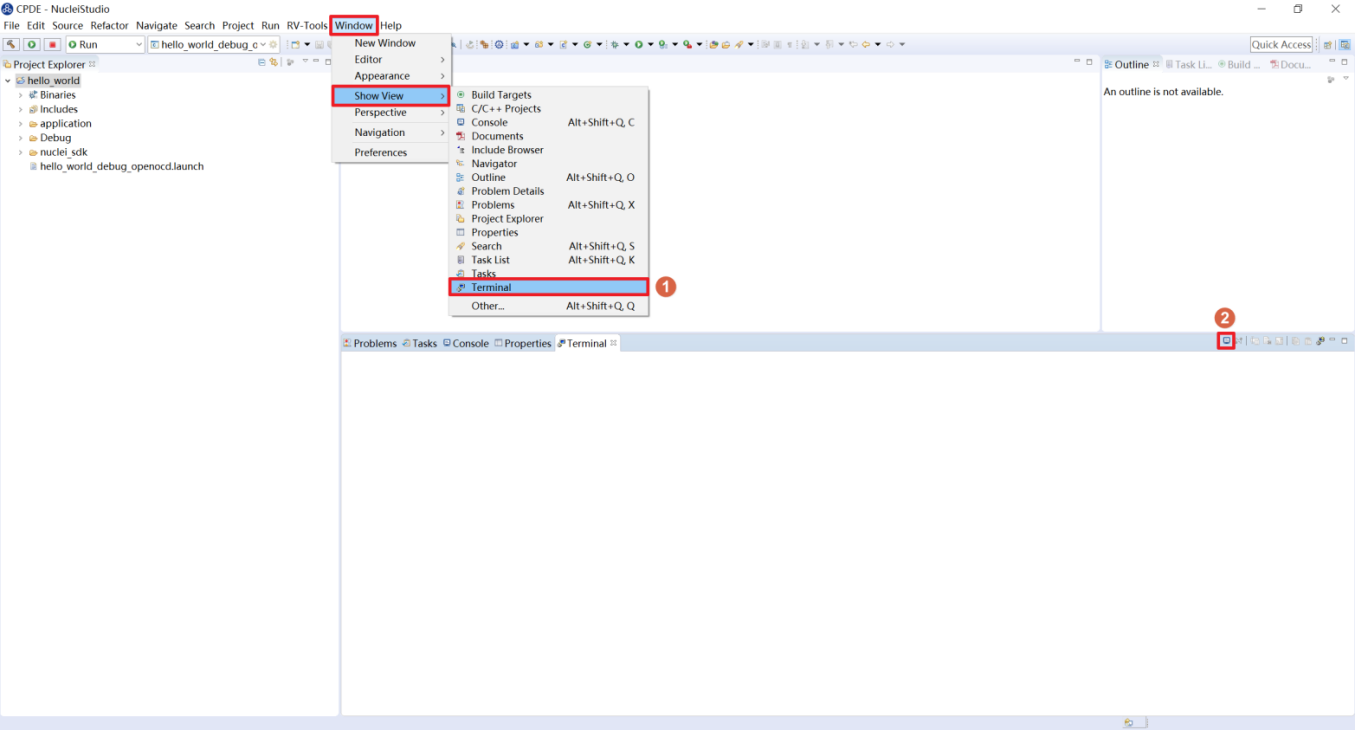
In the window, set Choose terminal to Serial Terminal, enter the serial port number (COM11 is used as an example here) and the baud rate (set to 115200), adjust the other parameters as needed, and then click the OK button.

To open the serial port on Linux:
Open the Terminal built into Nuclei Studio: select Window>Show View>Terminal, and click the monitor icon to open the terminal settings. Select Local Terminal for Choose terminal, and click OK to open the Terminal.
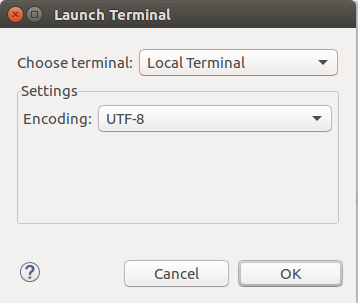
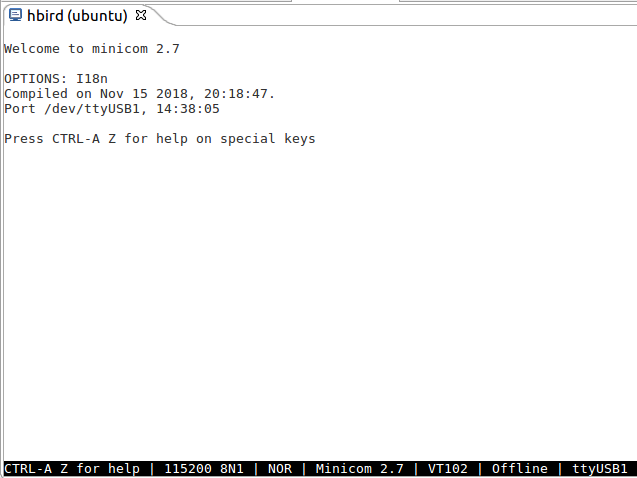
Enter minicom /dev/ttyUSB1 115200 in the window to open the serial port; you can then view the serial port output in Nuclei Studio.
To debug a program running on the prototype board, use the Nuclei Studio IDE. Because the IDE runs on the host PC while the program runs on the prototype board, this kind of debugging is also called online debugging or remote debugging.
The following steps use 1_helloworld as an example to perform online debugging on the evalsoc prototype board with the Nuclei Studio IDE:
Note
demosoc was removed in Nuclei SDK 5.0; use evalsoc instead.
Make sure the debug settings are correct. Right-click the 1_helloworld project and select Debug As –>Debug Configuration to open the debug settings page, then select the previously created configuration and check it.

After confirming the settings are correct, select Debug in the drop-down box. The icon on the left changes to a bug icon; click it to enter debug mode and download the program to the development board.

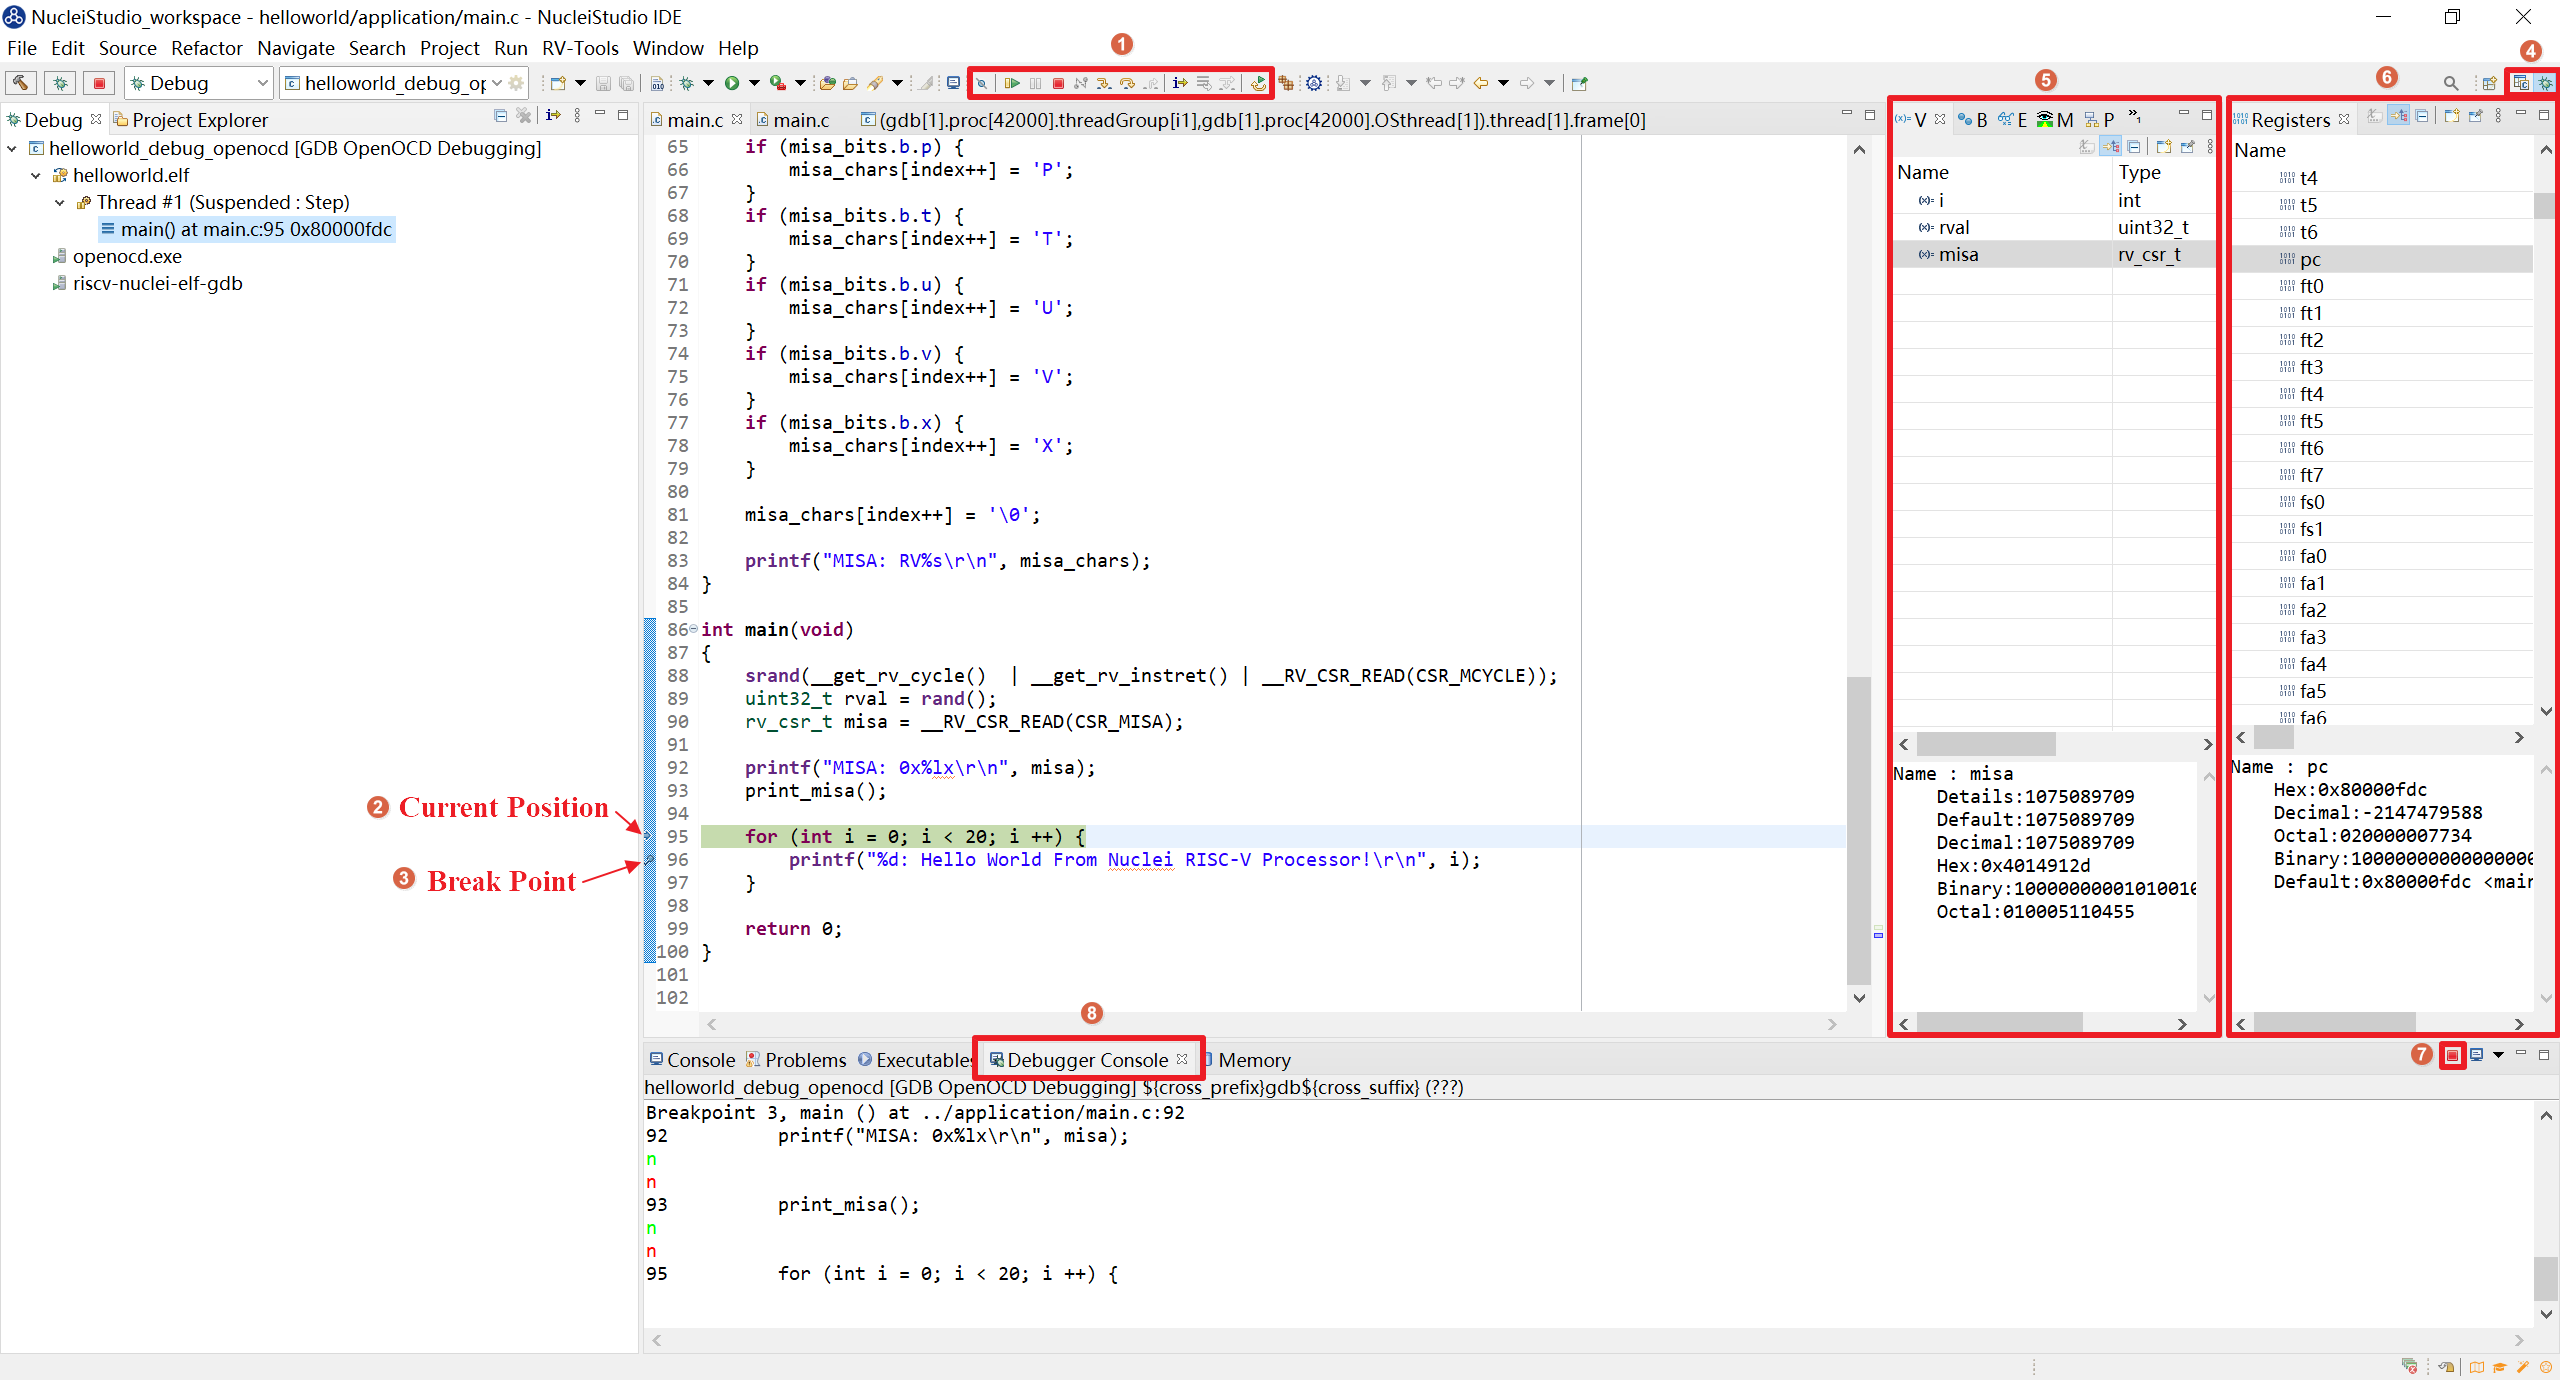
If the download succeeds, the debug perspective opens.
At marker 1: step, run, and assembly-level debugging functions.
At marker 2: the arrow indicates the current execution position of the program.
At marker 3: double-click in the left margin of a code line to set a breakpoint on that line; double-click again to remove the breakpoint.
At marker 4: switch between edit mode and debug mode here.
At marker 5: in-function variables are displayed here.
At marker 6: register values are viewed here. The figure shows the current value of the PC register.
At marker 7: click the red button here to exit debug mode.
Below marker 8: GDB console commands can be used here for debugging.
2.9.2.4. Downloading and Running the Program
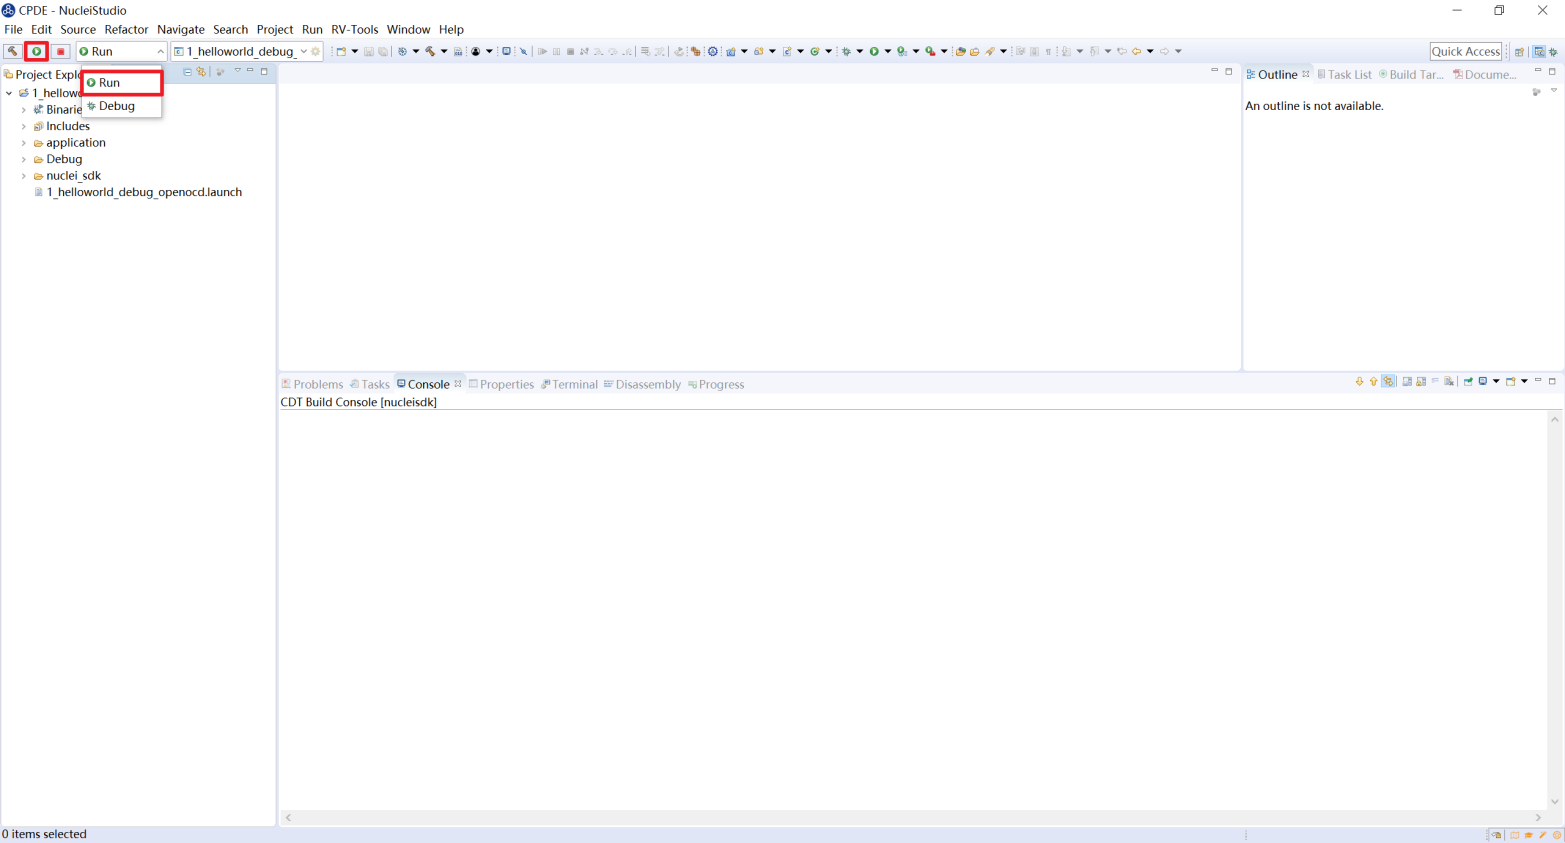
After debugging confirms there are no problems, the program can be downloaded to the development board. Click the drop-down box to switch to run mode; the icon on the left then changes to a green run button. Click it to download the program to the development board and run it. Because debugging and downloading use the same configuration file, no further setup is required.
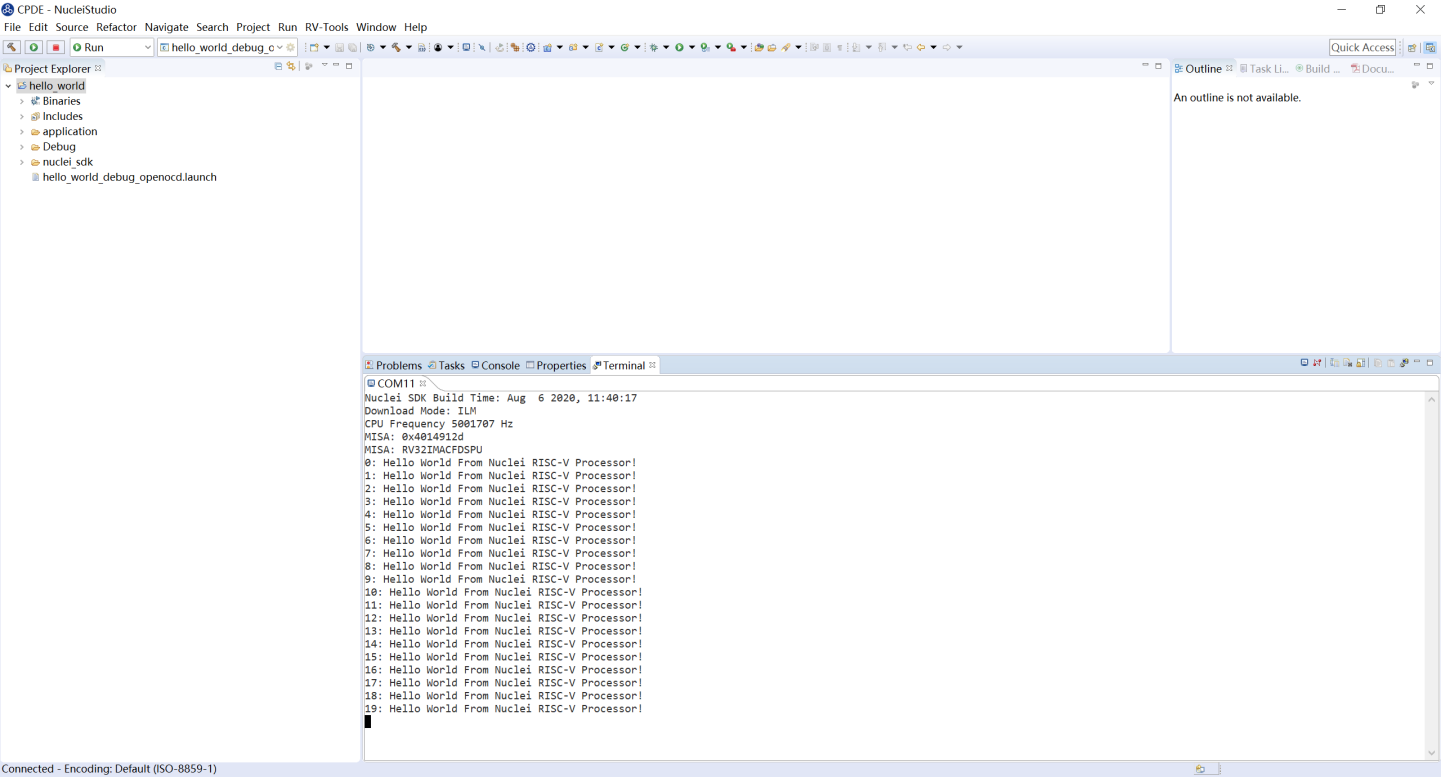
Once the program runs normally, the serial port correctly prints messages such as helloworld.
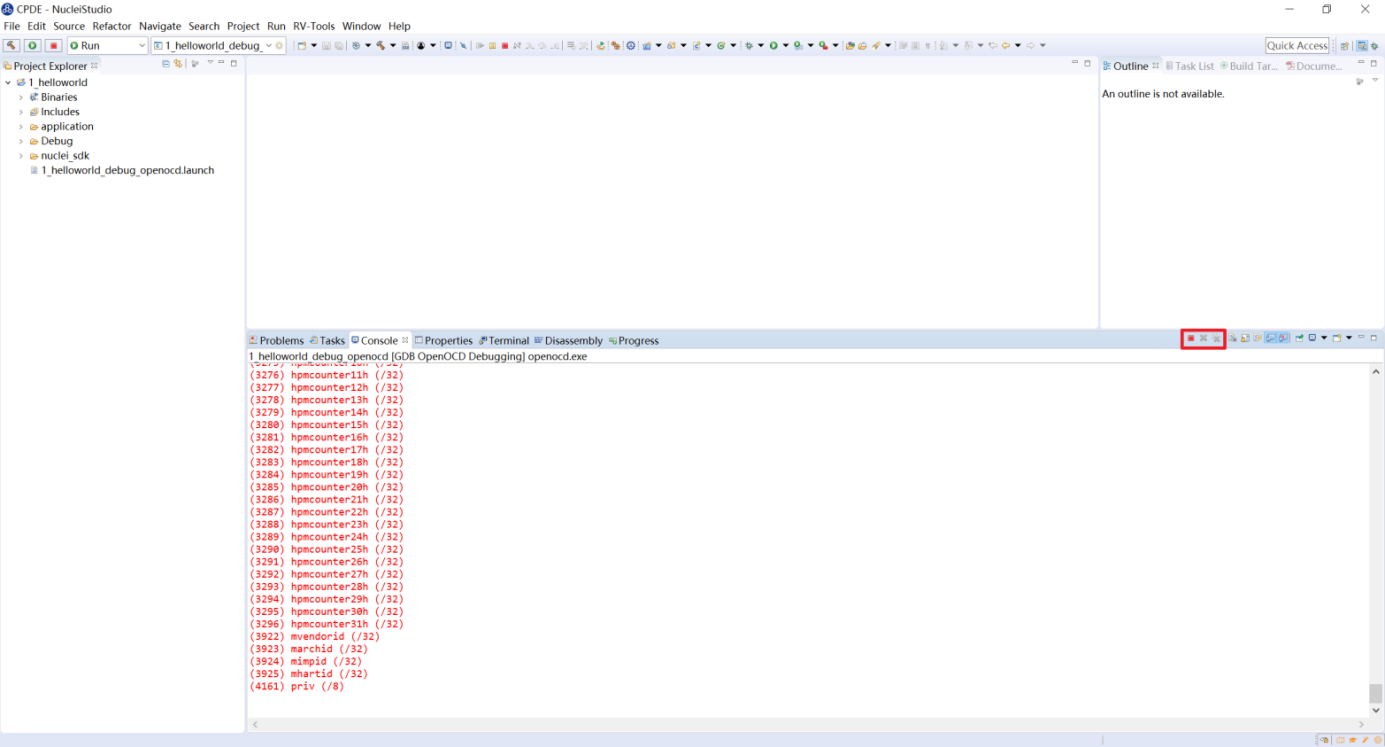
To stop the program and disconnect, click the red button in the console view.
2.9.3. Debugging and Running a Project with J-Link
Note
If you are using J-Link GDB Server, read the corresponding J-Link documentation to learn about its usage; see https://kb.segger.com/J-Link_GDB_Server
2.9.3.1. Installing the J-Link Driver and Importing the RTT Files
The HummingBird Evaluation Board also supports debugging with J-Link. Go to the J-Link page on the SEGGER website (https://www.segger.com/downloads/jlink/#J-LinkSoftwareAndDocumentationPack), download the latest J-Link driver for your operating system, and install it. Note that the J-Link version must be later than v6.62.
If you use the serial port for print output, you can skip the rest of this section. If you want to use J-Link RTT for print output, follow the steps below to configure it.
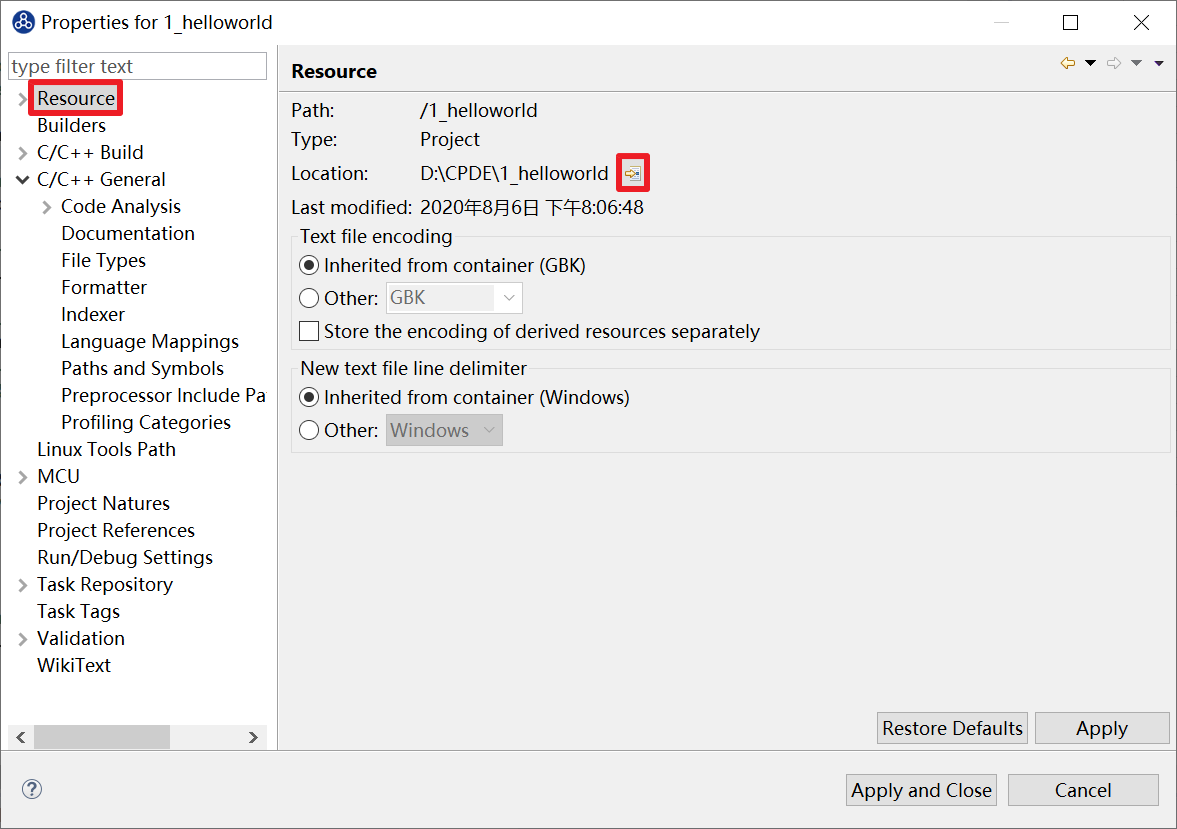
Open the settings page of the current project, and under the Resource option click the icon marked with the red box to quickly open the project directory.
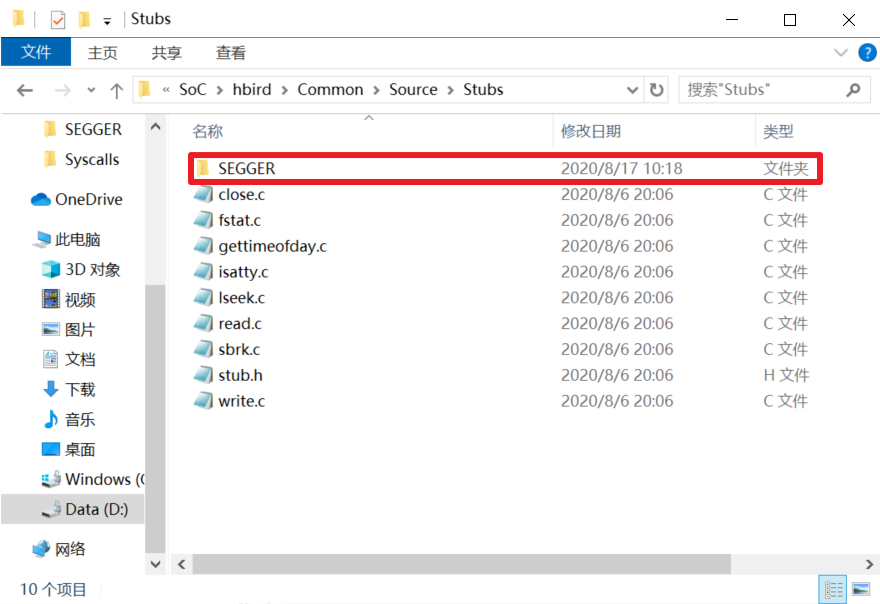
Create a new SEGGER folder under nuclei_sdk/SoC/evalsoc/Common/Source/Stubs to store the RTT-related files.
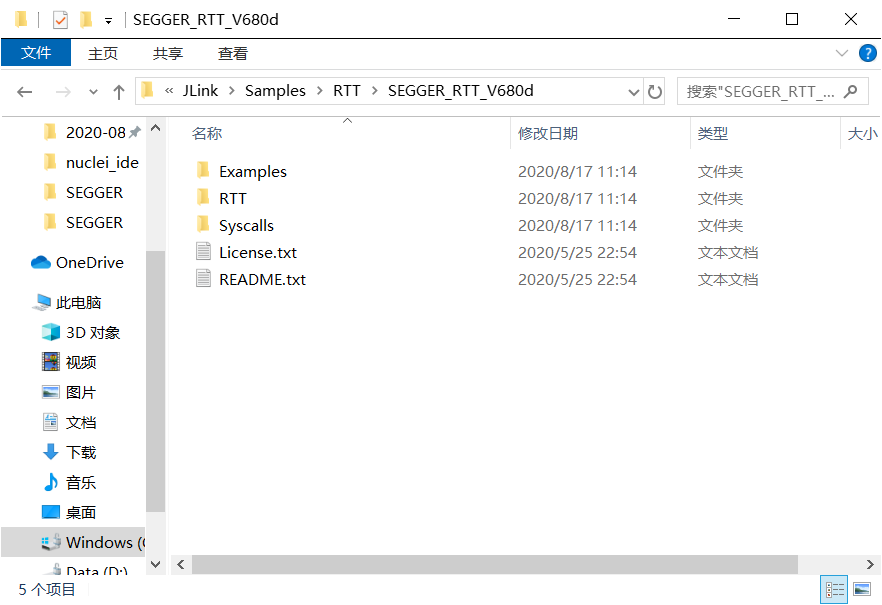
After installation, open the root directory of the J-Link driver and extract SEGGER_RTT_V680d.zip under Samples -> RTT (the exact archive name may vary by version). From the extracted files, copy SEGGER_RTT.c, SEGGER_RTT.h, and SEGGER_RTT_Conf.h from the RTT folder, as well as SEGGER_RTT_Syscalls_GCC.c from the Syscalls folder, into the newly created SEGGER folder.

Finally, open SEGGER_RTT_Syscalls_GCC.c in the IDE and comment out the line containing #include <reent.h>.

Next, add the SEGGER folder to the include paths: open the settings page of the current project and add the SEGGER folder path to the includes.

Then remove the original write function: right-click the write.c file under nuclei_sdk/SoC/evalsoc/Common/Source/Stubs and select Resource Configurations –> Exclude from Build. As shown in the figure, select Select All and click OK.

To switch back to serial port printing later, remove the SEGGER folder in the same way and add the write.c file back to the build.

2.9.3.2. Debug Configuration
2.9.3.2.1. Using the Debug Configuration Generated by Nuclei Studio
To simplify debugging, Nuclei Studio generates Debug Configuration launch files by default when a project is created, based on the NPK configuration.

Expand the project, select the corresponding test_debug_jlink.launch file, and choose Run as/Debug as->test_debug_jlink from the right-click menu to run or debug the project with the corresponding Debug Configuration.

You can view the details of the Debug Configurations in the Launch Bar.


2.9.3.2.2. Creating and Configuring a Debug Configuration
To create and configure a Debug Configuration for J-Link debugging and downloading:
Select Run—>Debug Configurations in the menu bar. In the dialog that opens, if there is no debug configuration for the current project, right-click GDB SEGGER J-Link Debugging and select New Configuration to create a new debug configuration 1_helloworld Debug for the project.

Make sure Project is the project you want to debug, and that C/C++ Application points to the correct ELF file to debug.

Open the Debugger tab and make sure Start the J-Link GDB server locally at position 1 is selected.
Position 2 must point to the correct path of JLinkGDBServerCL.exe.
Position 3 is the core in use; N307 is used as an example here, so enter N307. If you use the RV-STAR development board, enter GD32VF103VBT6 here. For other development boards, see the J-Link Supported Devices page: https://www.segger.com/downloads/supported-devices.php
At position 4, select Interface as JTAG and initial speed as Auto.
At position 5, confirm that it matches the GDB settings in use.
If you modified anything, click Apply at position 6 to save.

Open the Startup tab, make sure JTAG/SWD Speed is Auto, that set Breakpoint at main, Continue, Pre-run/Restart reset, and RAM application are checked, and that the Initial Reset and Halt option is unchecked.

If you changed any of the above settings, click Apply at the bottom right to save them; if nothing changed, click Close.
2.9.3.3. Debugging the Program on the Prototype Board
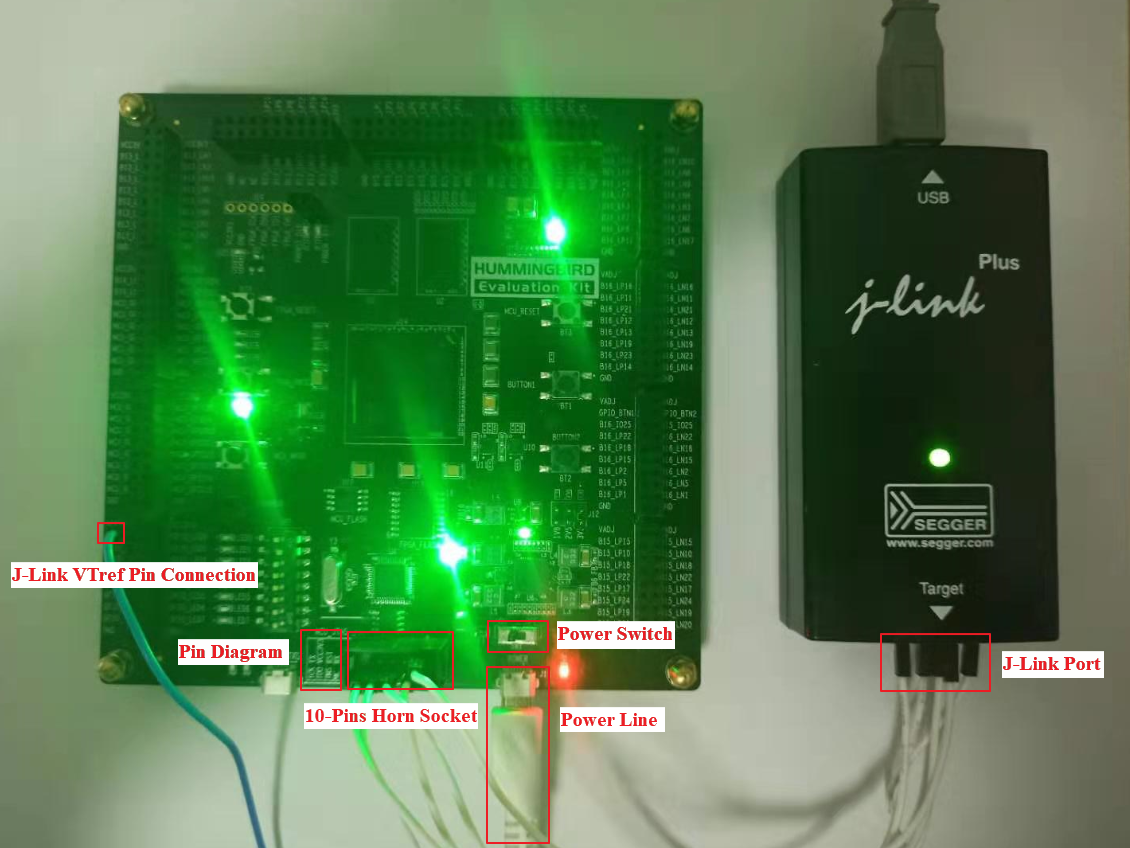
Debugging with J-Link on the HummingBird Evaluation Board requires jumper wires. Connect J-Link to the board at the position marked with the red box.
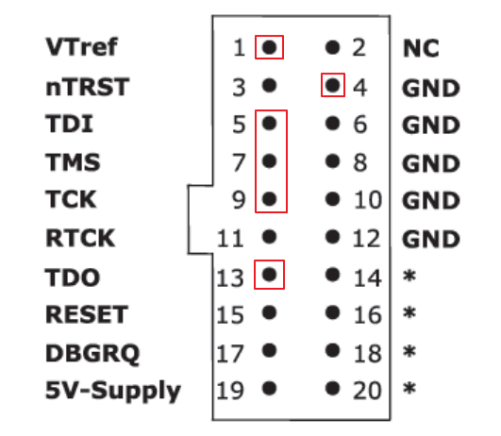
Connect VTref to the V3.3 connector on the board and the other pins to the JTAG interface. Each pin’s silkscreen label is printed right next to it, so connect the pins one-to-one accordingly. The final physical connection is shown below.
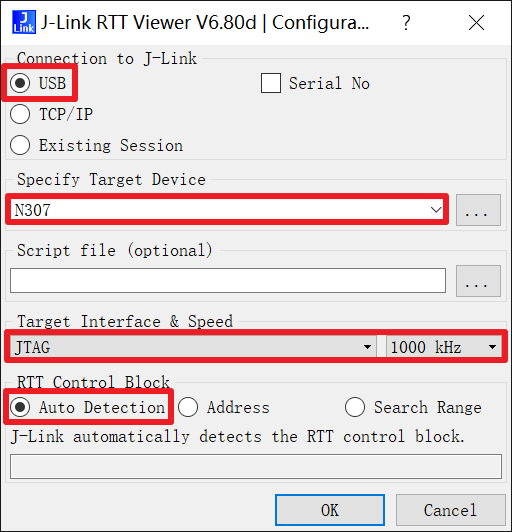
Before debugging on the board, if you use serial port printing, connect the UART pins on the JTAG header to your host, and then open the serial port to observe the printf output. If you use RTT printing, open J-Link RTT Viewer to view the printf output. Configure it as shown in the figure and select USB as the connection method. Set Specify Target Device according to the core in use; N307 is used as an example here. Set Target Interface & Speed to 1000kHz, which can be adjusted based on actual use. Select Auto Detection for RTT Control Block.
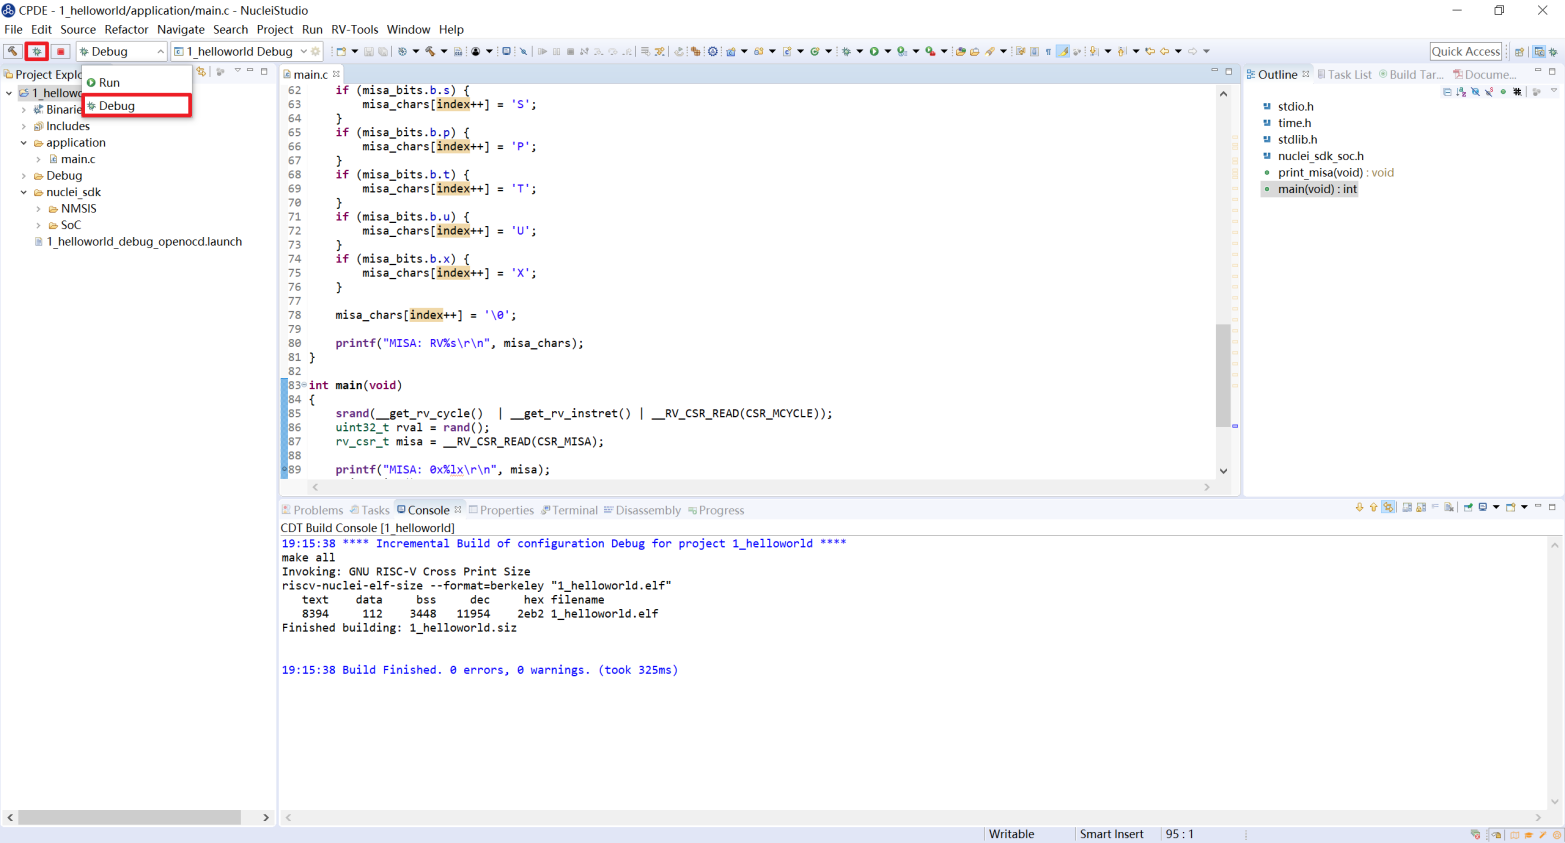
Select Debug in the Launch Bar drop-down box. The icon on the left then changes to a bug icon; click it to enter debug mode and download the program to the development board.
If the program downloads successfully, Nuclei Studio opens the debug perspective.
At marker 1: step, run, and assembly-level debugging functions.
At marker 2: the arrow indicates the current execution position of the program.
At marker 3: double-click in the left margin of a code line to set a breakpoint on that line; double-click again to remove the breakpoint.
At marker 4: switch between edit mode and debug mode here.
At marker 5: in-function variables are displayed here.
At marker 6: register values are viewed here.
At marker 7: click the red button here to exit debug mode.
Below marker 8: GDB console commands can be used here for debugging.
2.9.3.4. Downloading and Running the Program
After debugging confirms there are no problems, the program can be downloaded to the development board. Click the drop-down box to switch to run mode; the icon on the left then changes to a green run button. Click it to download the program to the development board and run it.
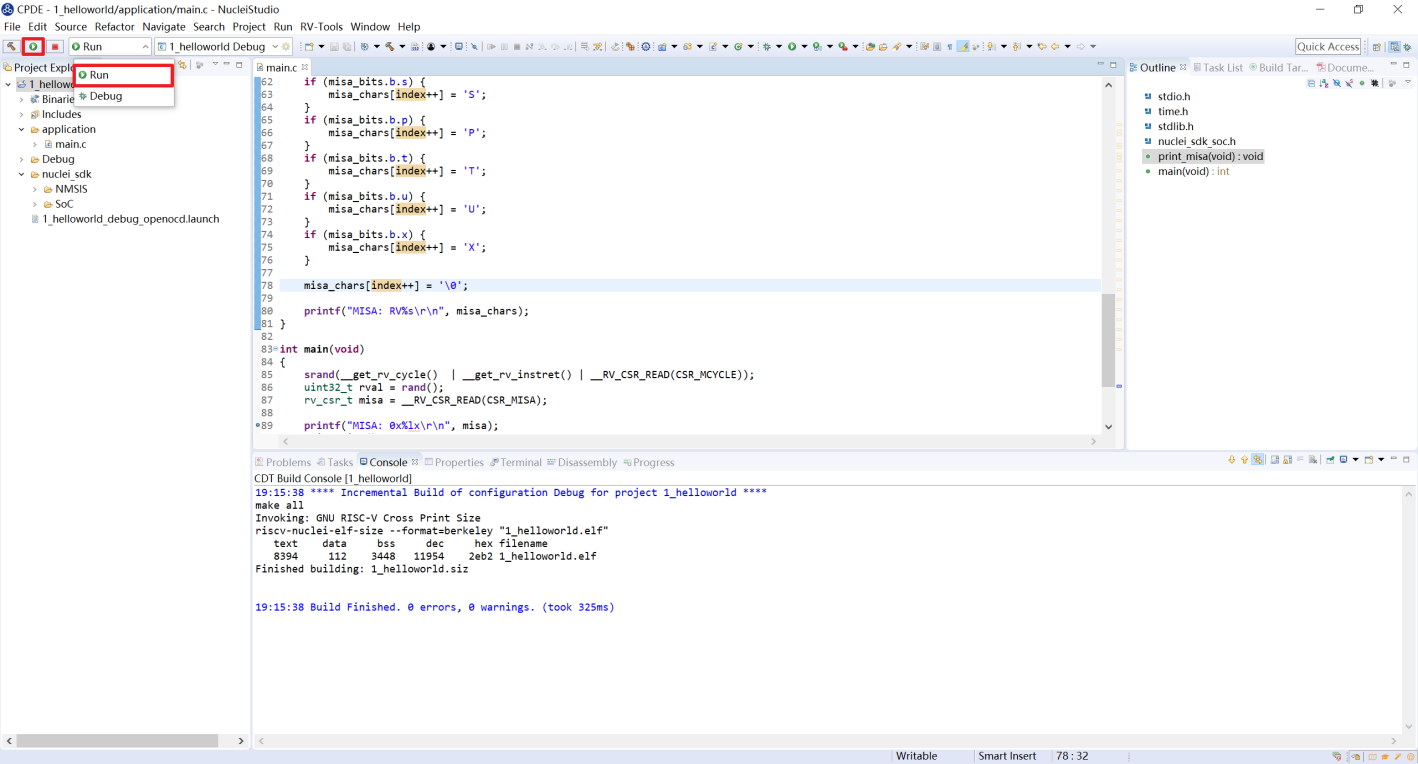
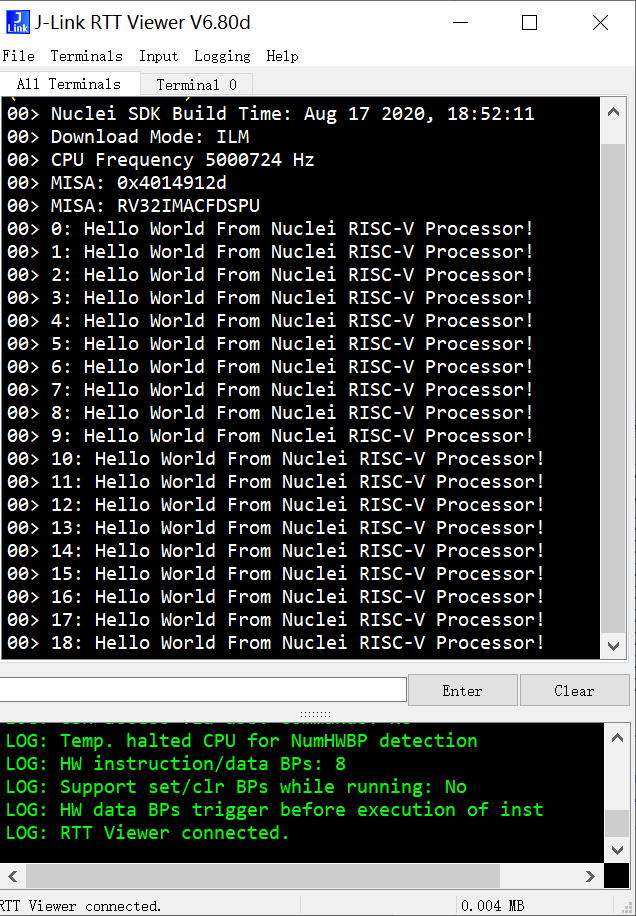
Because debugging and downloading use the same configuration file, no further setup is required. The RTT Viewer correctly prints messages such as helloworld.
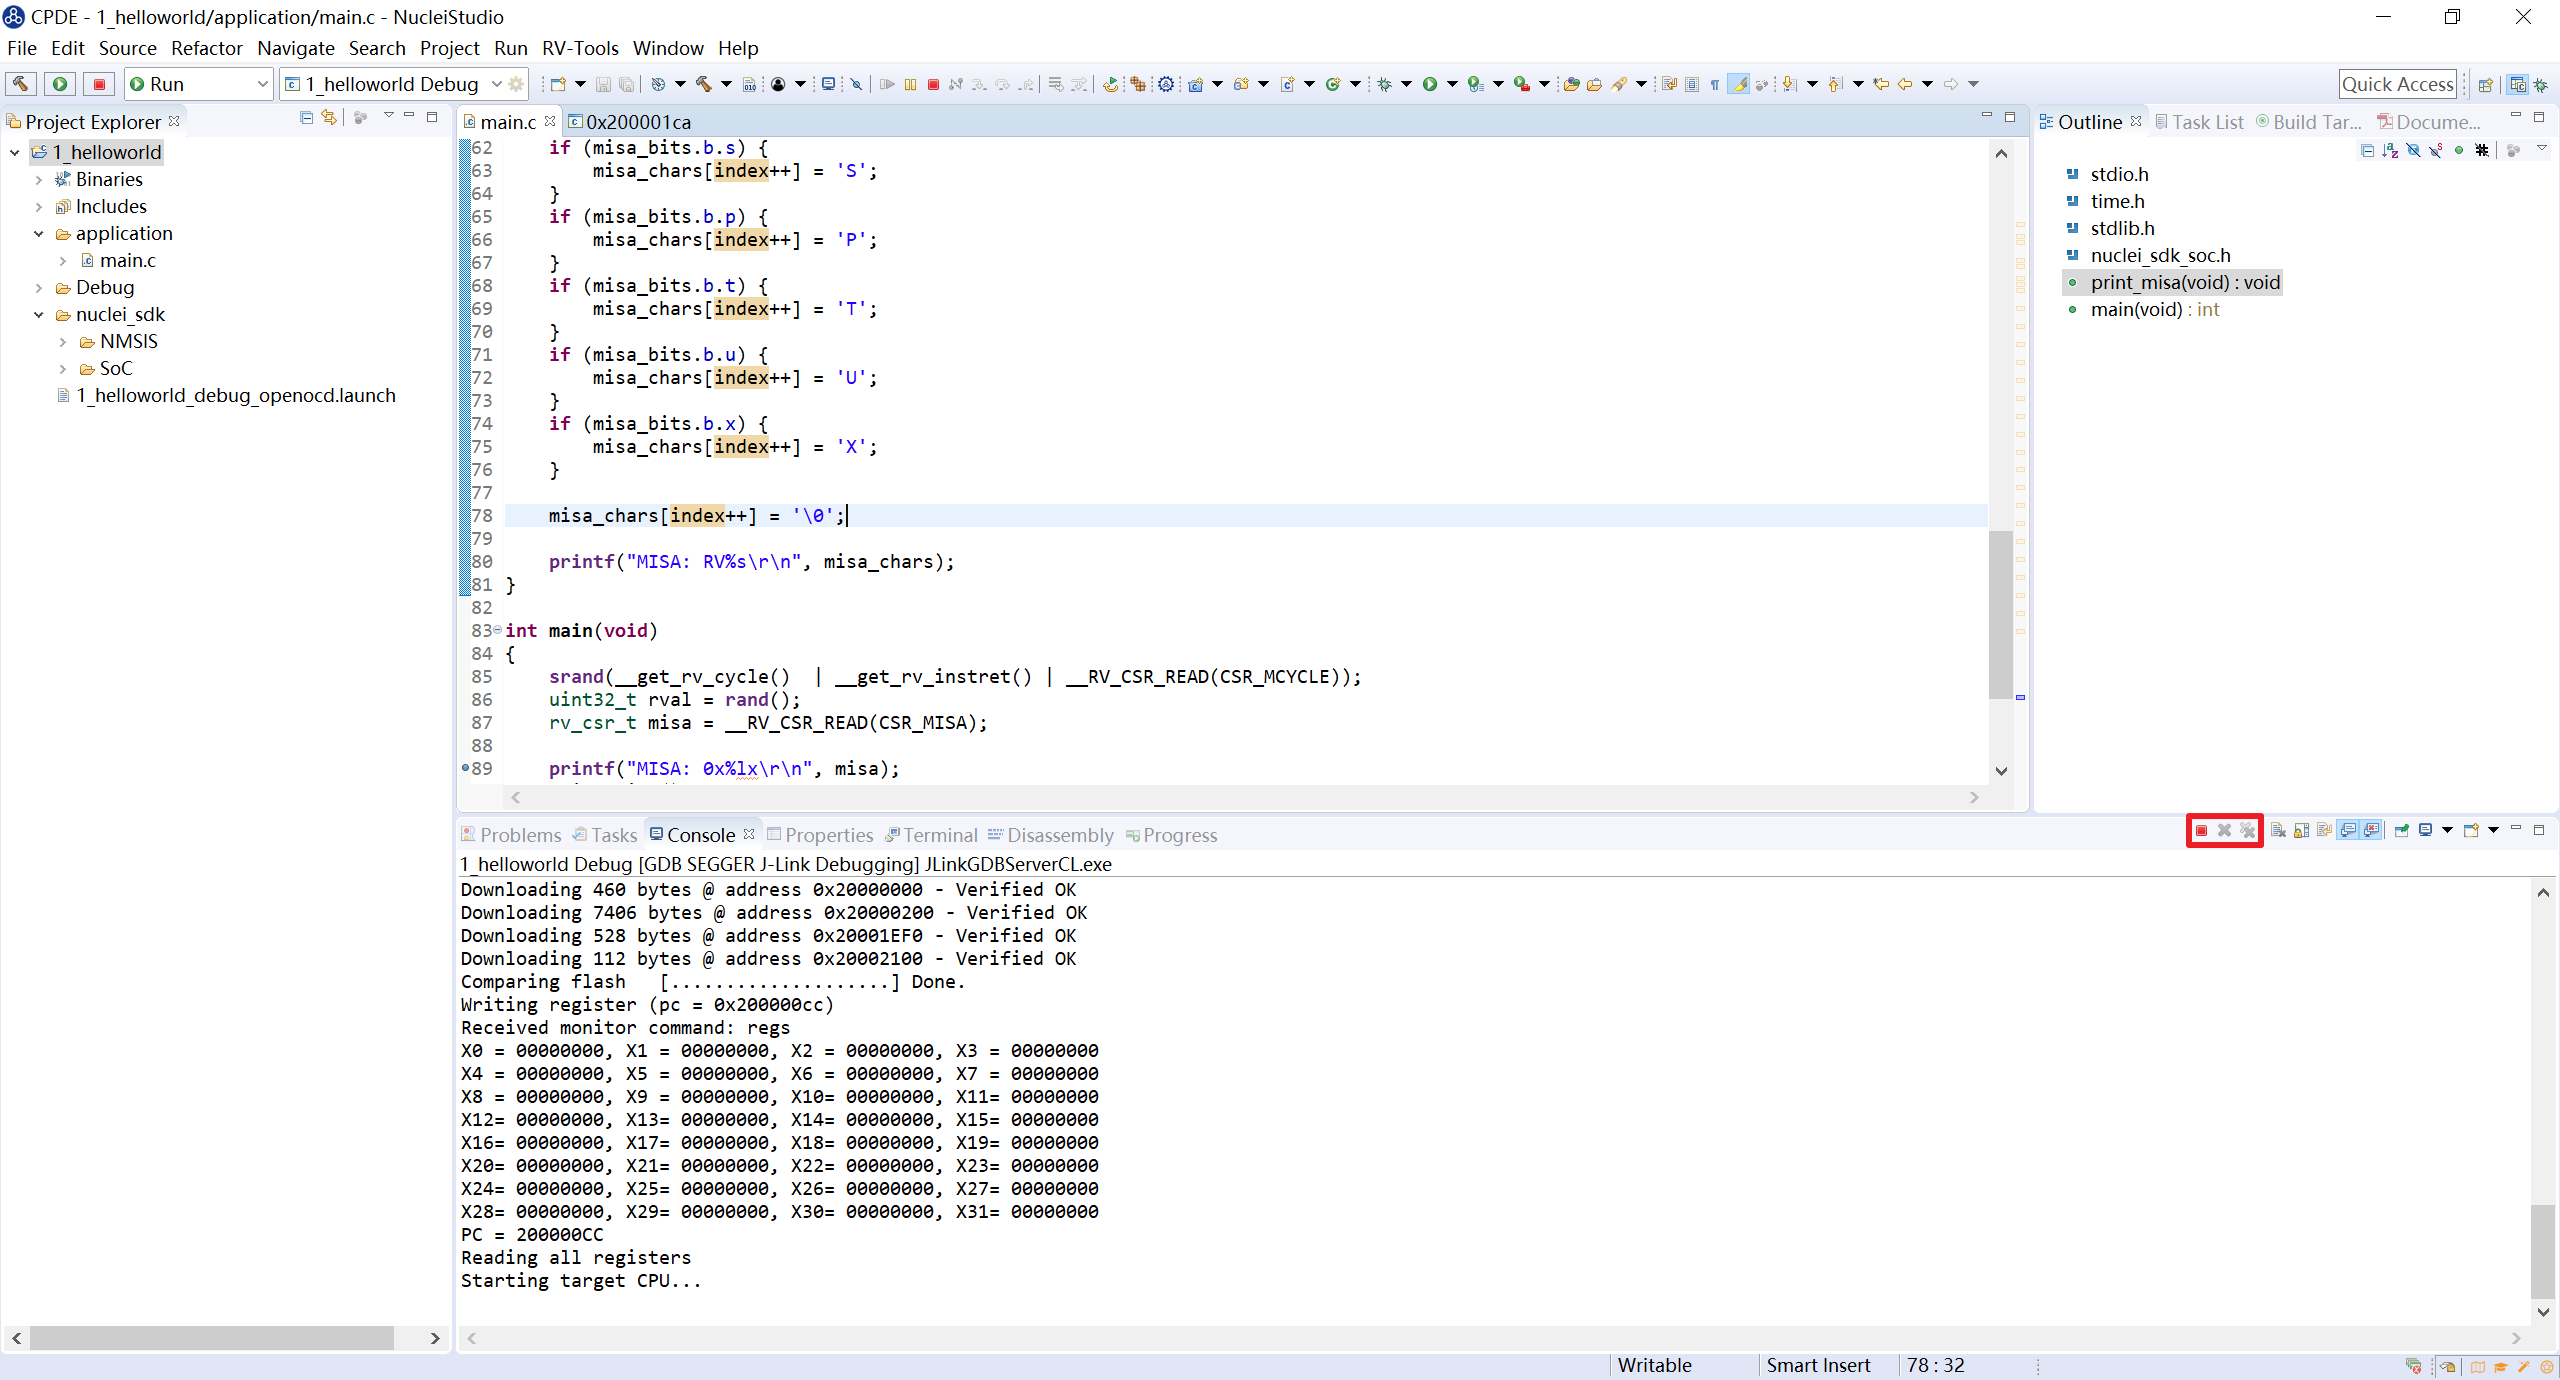
To disconnect, click the red button in the console view.
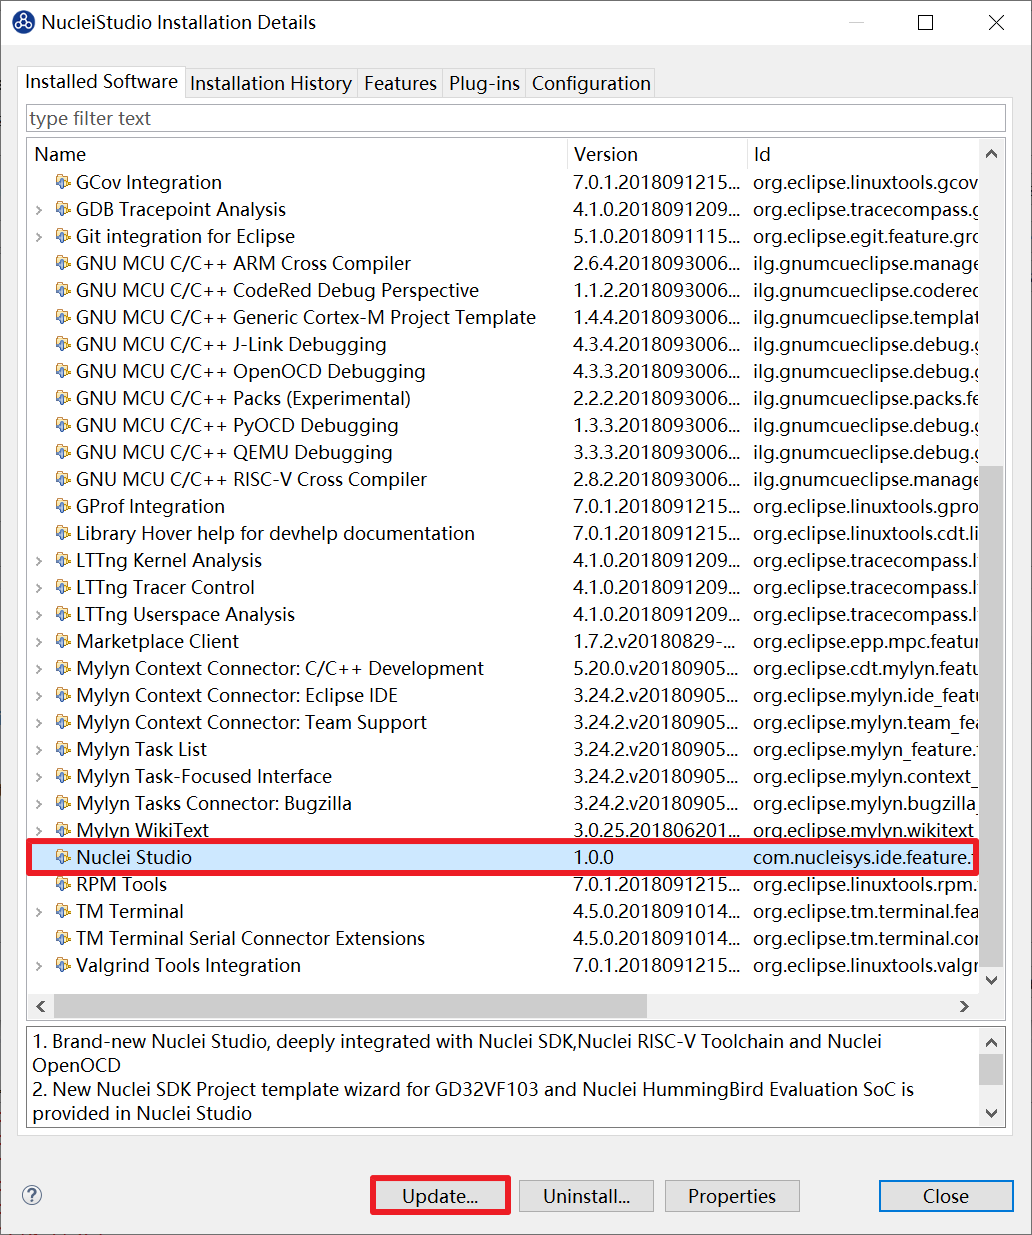
2.9.4. Debugging and Running a Project with DLink
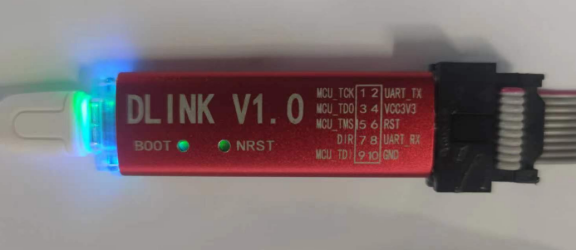
DLink is a RISC-V debugger developed by Nuclei System Technology based on RV Link, with iterative feature upgrades on top of RV Link that make it better suited to Nuclei Studio use cases. DLink currently supports debugging and running single-core RISC-V projects only, and is already in mass production. The actual device is shown below. For the DLink firmware download, see https://github.com/Nuclei-Software/nuclei-dlink/wiki/upload-dlink-firmware.
Note
The Nuclei WeChat video channel has a video on how to debug a program with DLink in Nuclei Studio. Search for the Nuclei video channel in WeChat to view the related content.
To debug with DLink, select Run -> Run Configurations in the Nuclei Studio menu to open the Run Configurations page, and configure a DLink Debug Configuration: double-click GDB Custom Debugging to create a new configuration, and configure the Main tab as follows:

To install the driver on Windows:
Open the GD website, search for GD32VF1, find GD32 Dfu Drivers in the list, and download and install it.
Address: https://www.gd32mcu.com/en/download/7?kw=GD32VF1

To install the driver on Linux:
1: Connect the development board to the Linux host and make sure the USB device is recognized.
2: Run
lsusbin the console to view the device information; for example:
Bus 003 Device 057: ID 28e9:018a GDMicroelectronics Dlink Low Cost Scheme
3: In the console, run
sudo vi /etc/udev/rules.d/50-dlink.rulesto open the 50-dlink.rules file, enter the following content, save and exit, and then runsudo udevadm control --reload.
SUBSYSTEM=="usb", ATTR{idVendor}=="28e9",

ATTR{idProduct}=="018a", MODE="664", GROUP="plugdev"

SUBSYSTEM=="tty", ATTRS{idVendor}=="28e9",

ATTRS{idProduct}=="018a", MODE="664", GROUP="plugdev"
4: Disconnect the debugger and reconnect it.
5: Run
ls /dev/ttyACM*to view the ttyACM information; for example:
/dev/ttyACM0 /dev/ttyACM1
6: Run
ls -l /dev/ttyACM0to view the group information; an example output is shown below. As shown,ttyACM0belongs to thedialoutgroup. Next, add your user to thedialoutgroup (the group name may differ between environments; adjust it to your actual situation). Runwhoamito view the current user name, denoted below as<your_user_name>.
crw-rw-r-- 1 root dialout 166, 0 Jun 28 15:25 /dev/ttyACM0
7: Run
sudo usermod -a -G dialout <your_user_name>to add yourself to the dialout group. You must reboot or log out for the change to take effect.8: Run
groupsto confirm that the current user belongs to thedialoutgroup. Ifdialoutappears in the output, the user was added successfully; otherwise, try rebooting.
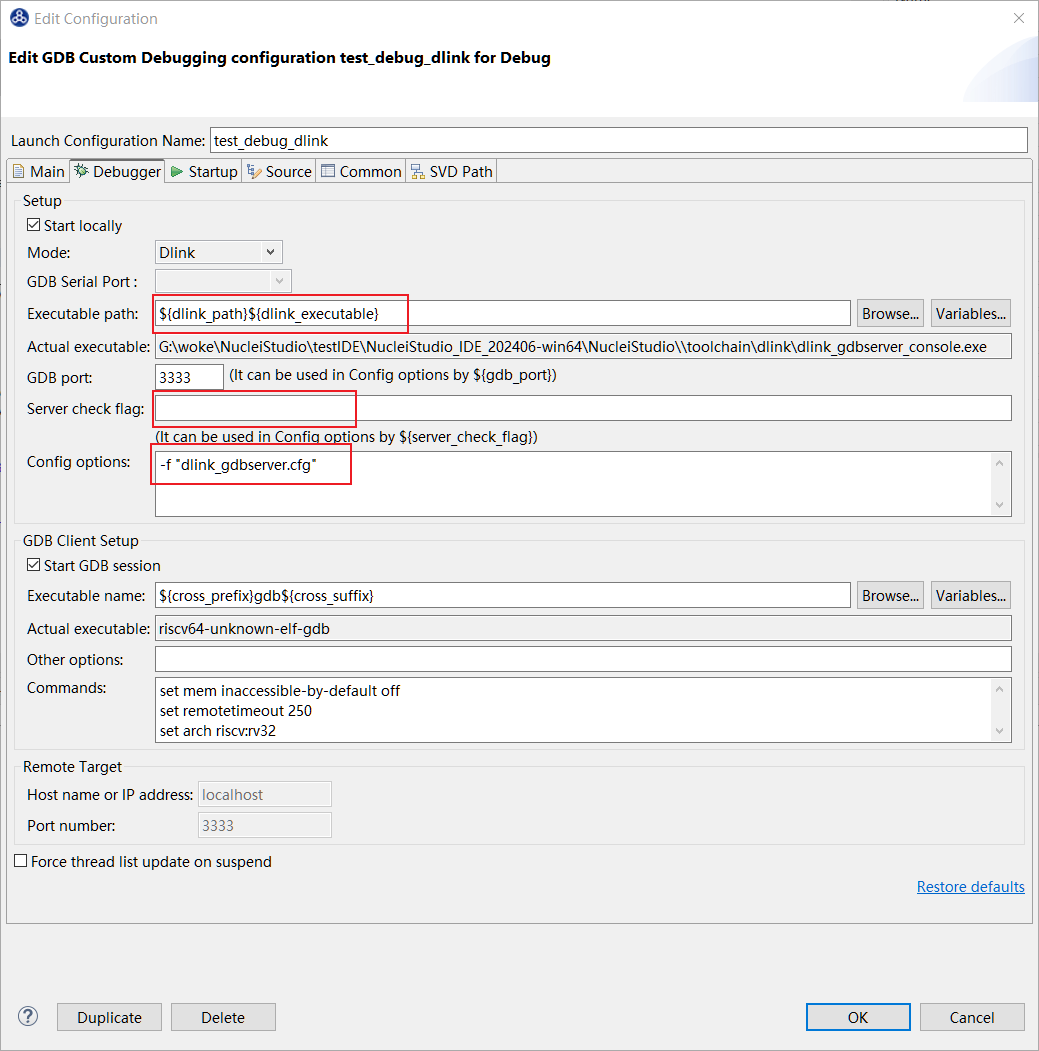
Then configure the Debugger tab as follows. Custom Debugging supports multiple modes; because DLink is used here, select DLink. Nuclei Studio uses Server check flag to confirm whether the server has started normally: when the Custom GDB Server starts normally, it outputs a string, and Nuclei Studio checks this string to confirm that the Custom GDB Server has started; with DLink, this field can be left empty. In Config options, configure the corresponding connection file dlink_gdbserver.cfg; a reference configuration file is available in the <NucleiStudio>/toolchain/dlink directory.
On Windows, once the DLink connects the PC and the development board, a green LED and a blue LED light up, indicating that the DLink is working properly. If they do not, press the NRST button to reset it.
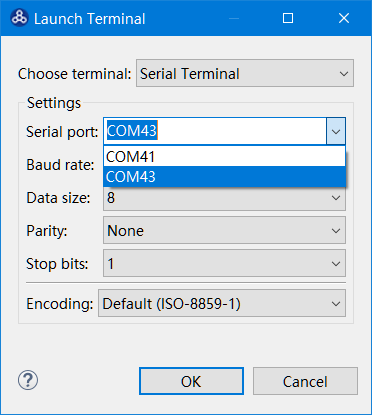
After the DLink is connected, two COM ports appear in the serial port tool. One COM port is used for serial output — generally the COM port with the lower number is used for debugging — and the other is used for serial data exchange. Specify the COM port used for data exchange in dlink_gdbserver.cfg by configuring serial port and serial baud, for example serial port COM1 and serial baud 115200 on Windows, or serial port ttyACM0 and serial baud 115200 on Linux. If they are not configured, DLink uses the COM port with the lower number and its corresponding baud rate as the defaults. The following is a reference configuration on Windows:

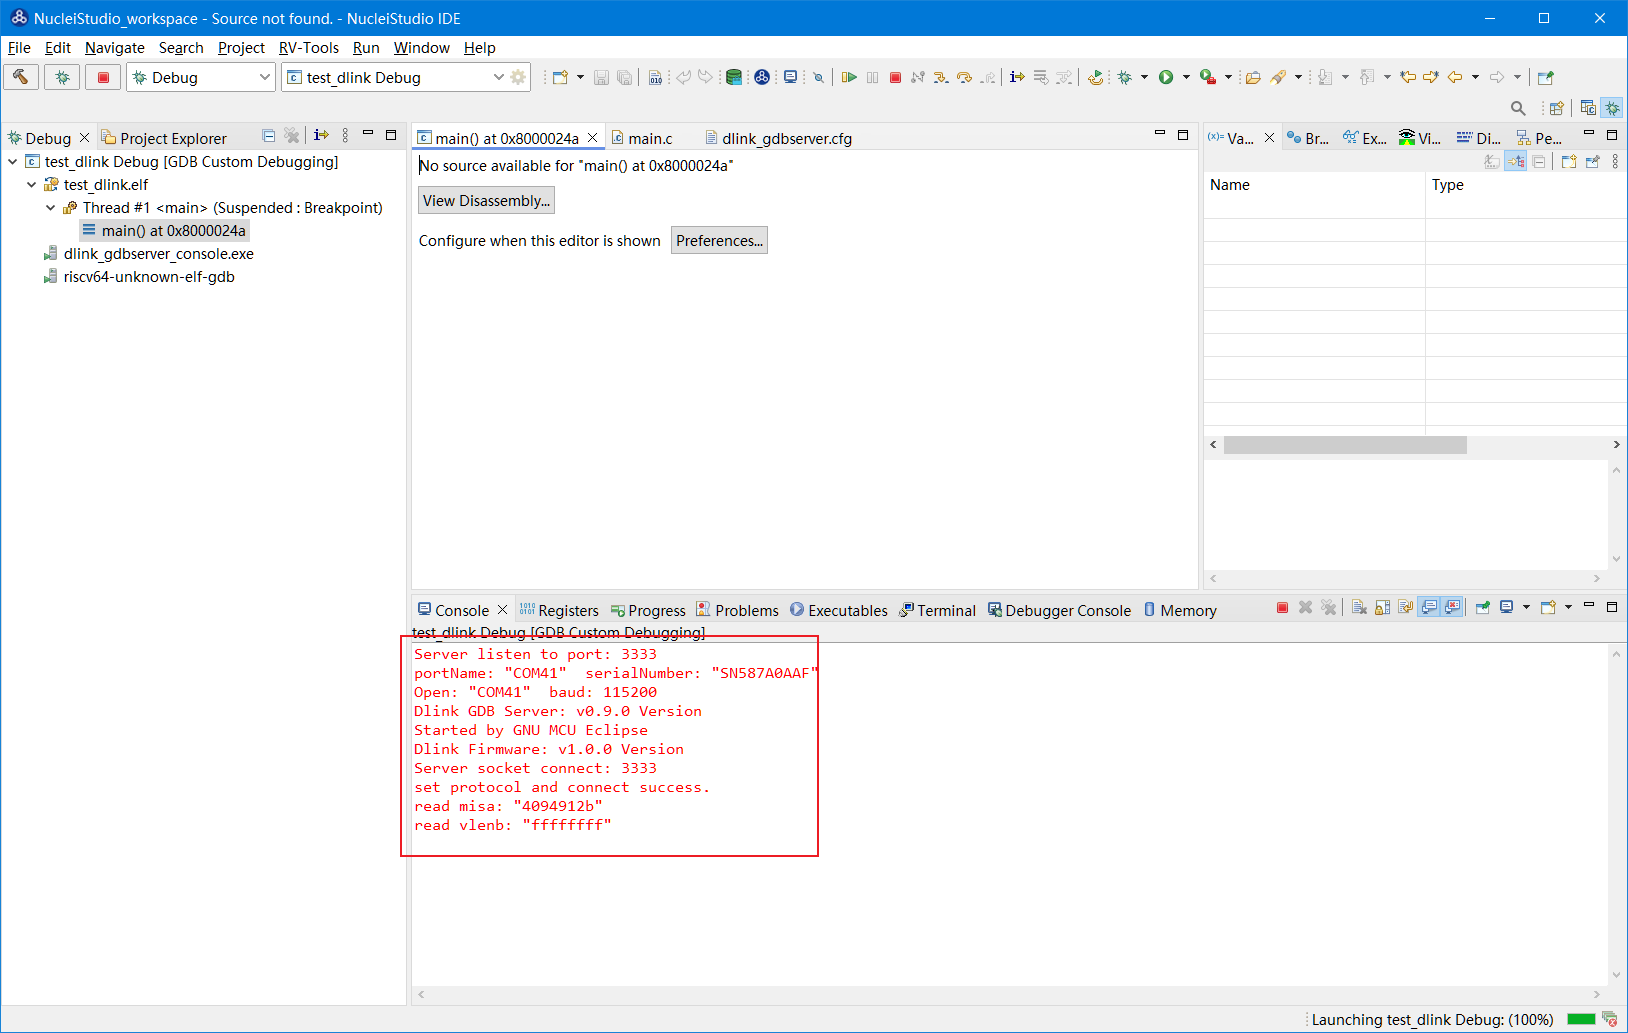
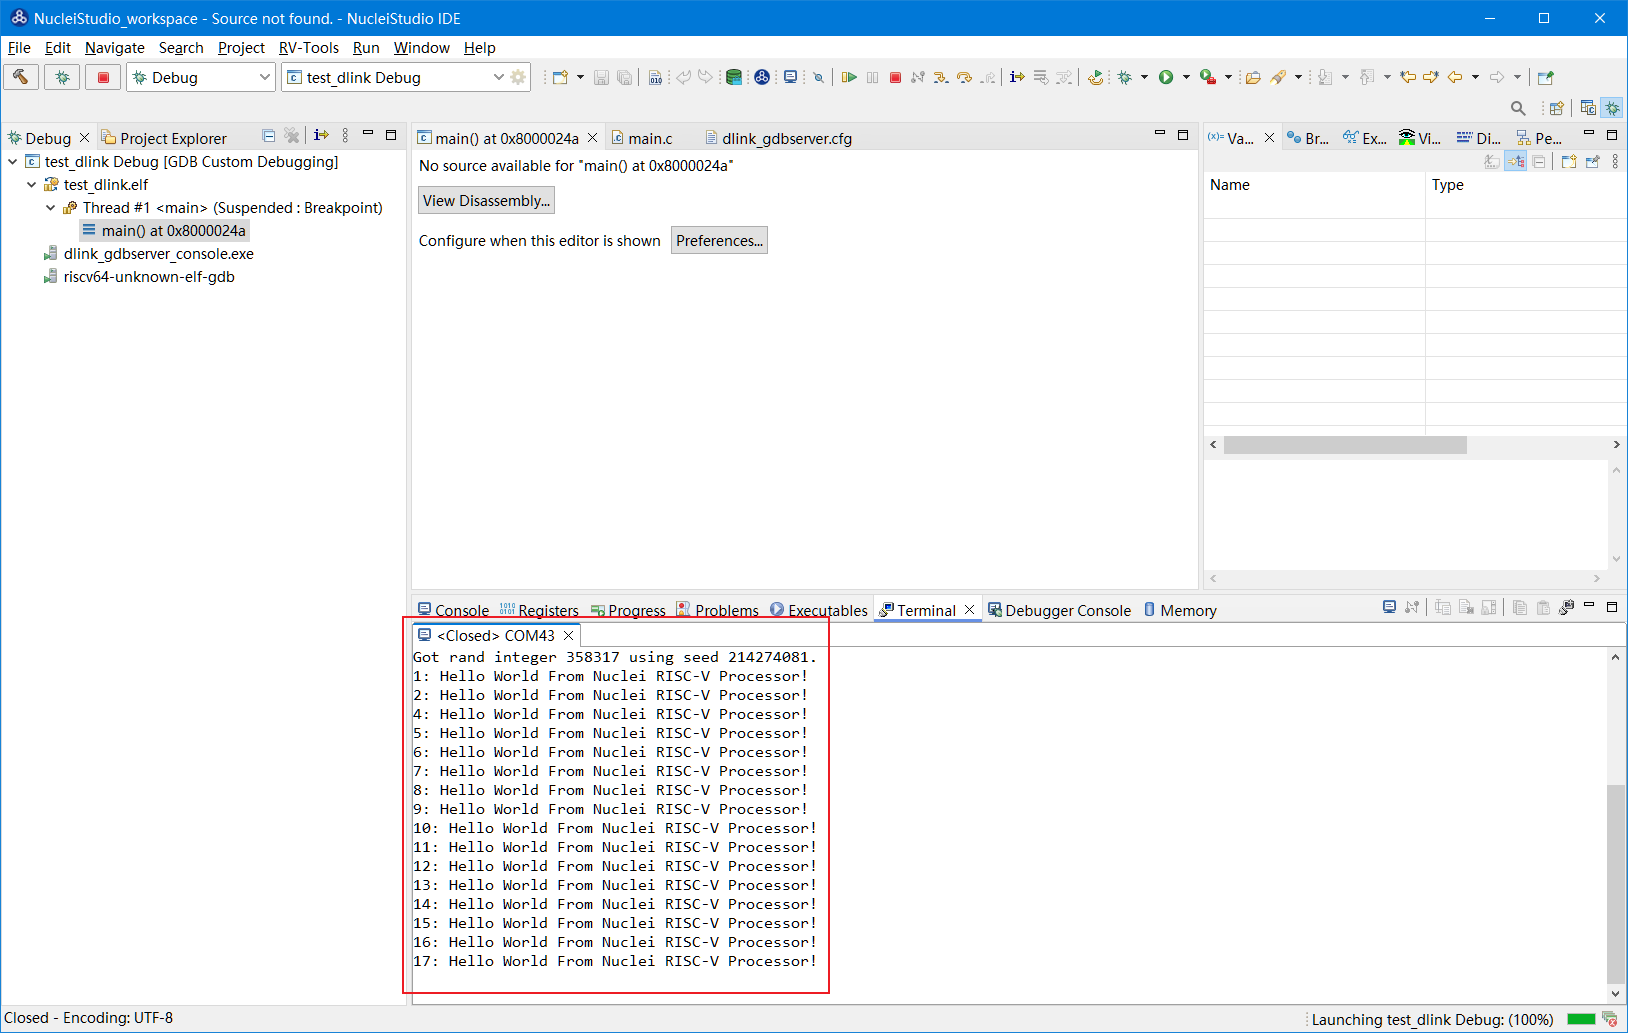
Start debugging. If the configuration is correct, the Console shows the following output, and the DLink lights up green.
Use a serial port tool to connect to the other serial port.
If the serial port shows the correct output as expected, DLink debugging works properly. The remaining steps are largely the same as with OpenOCD.
2.9.5. Connect to Running Target
To support connecting directly to a development board, Nuclei Studio provides the Connect to Running Target feature. This feature connects directly to a running hardware target board, allowing you to perform operations such as reading board-related information, which greatly improves development efficiency.
In Nuclei Studio, Connect to Running Target supports only OpenOCD and J-Link. The following example demonstrates its usage with OpenOCD.
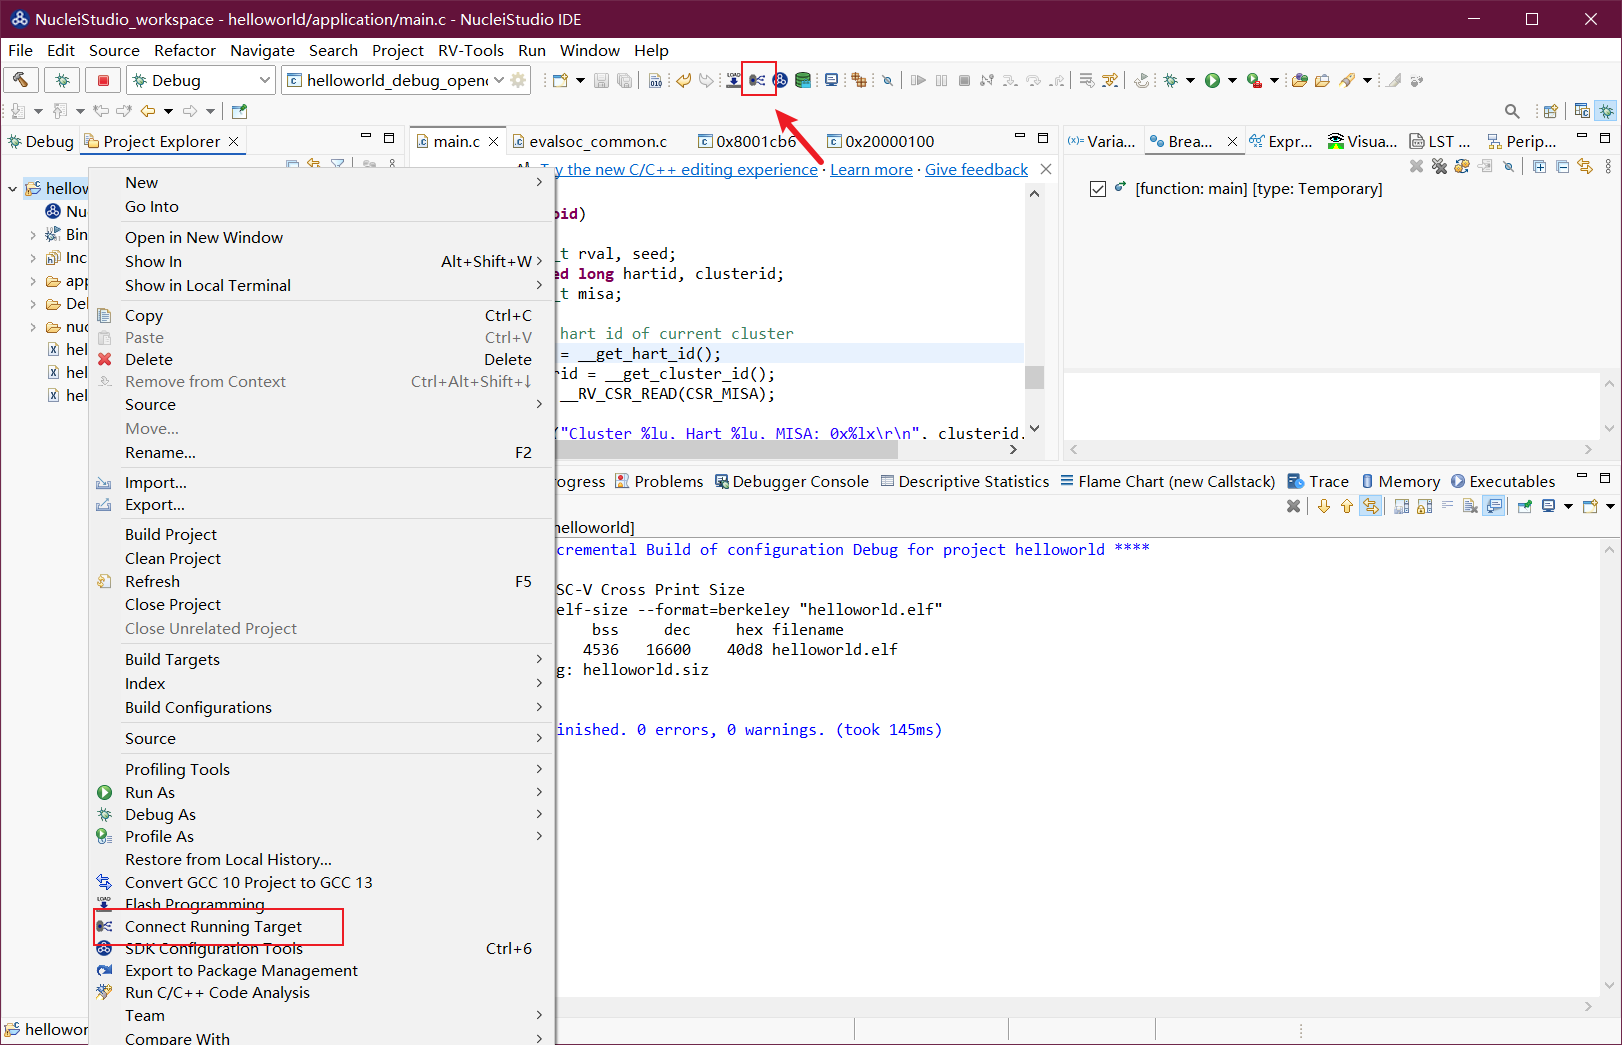
Using the Connect to Running Target feature is very simple. Connect the development board and create a demo project. After the project is built, select the project and click Connect to Running Target from either the right-click menu or the IDE tool menu.
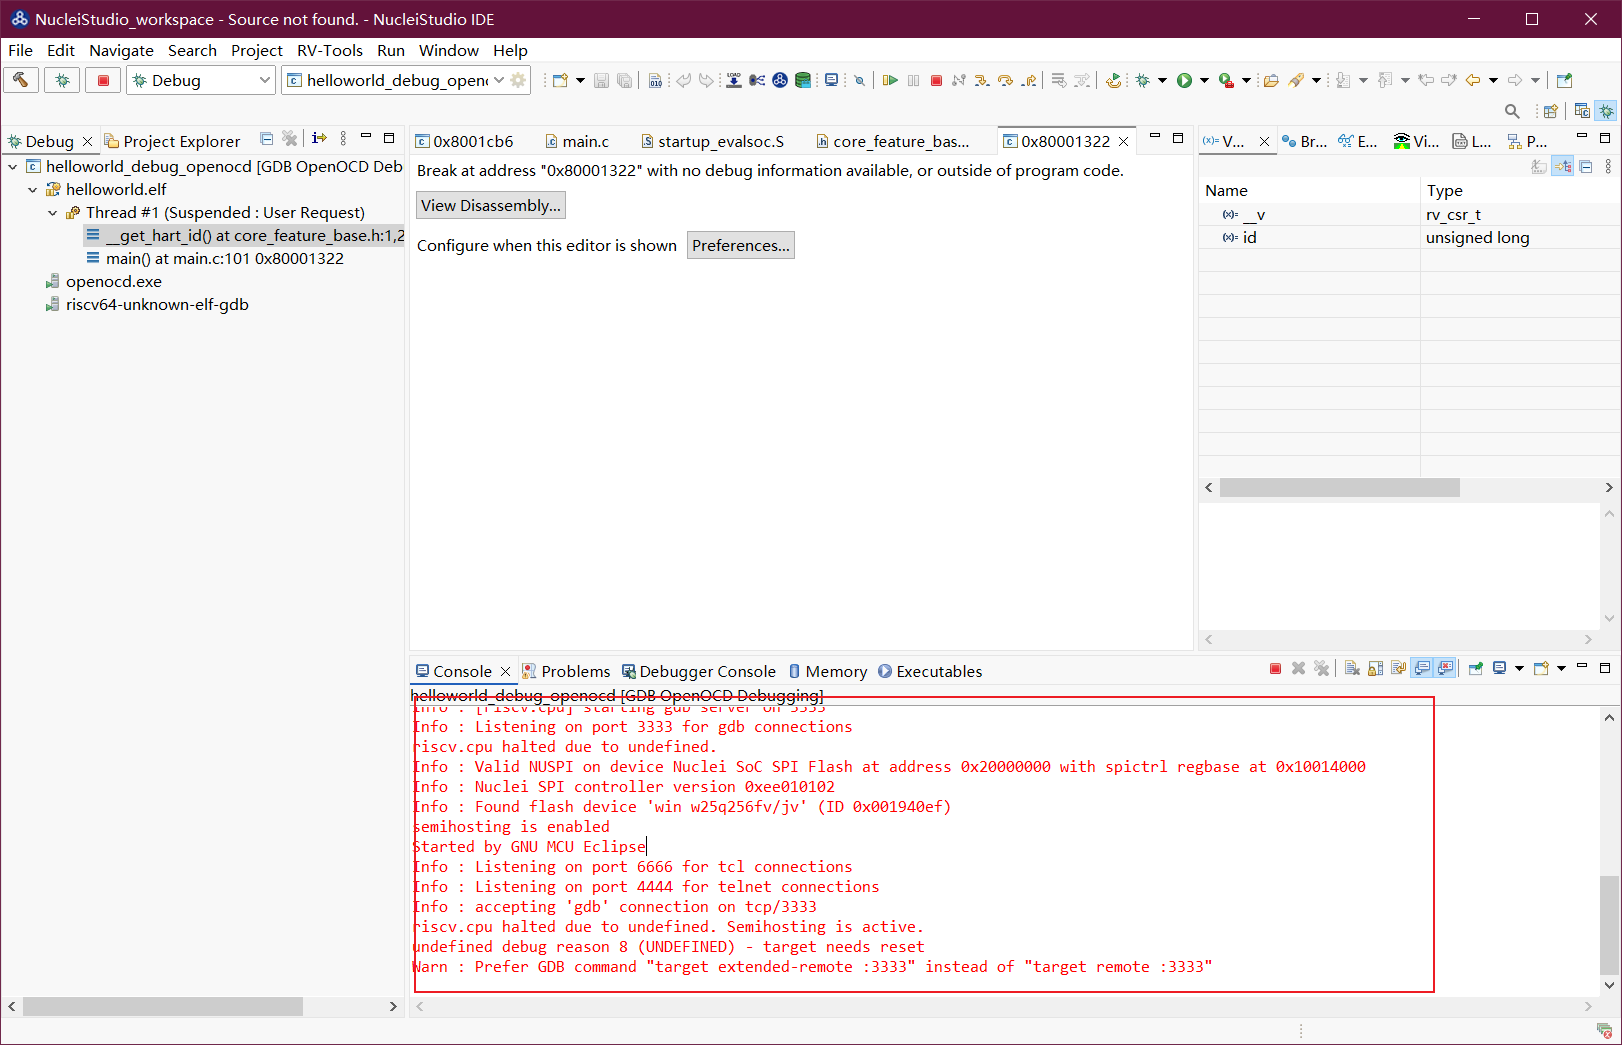
In the console window, you can see GDB trying to connect to the development board.
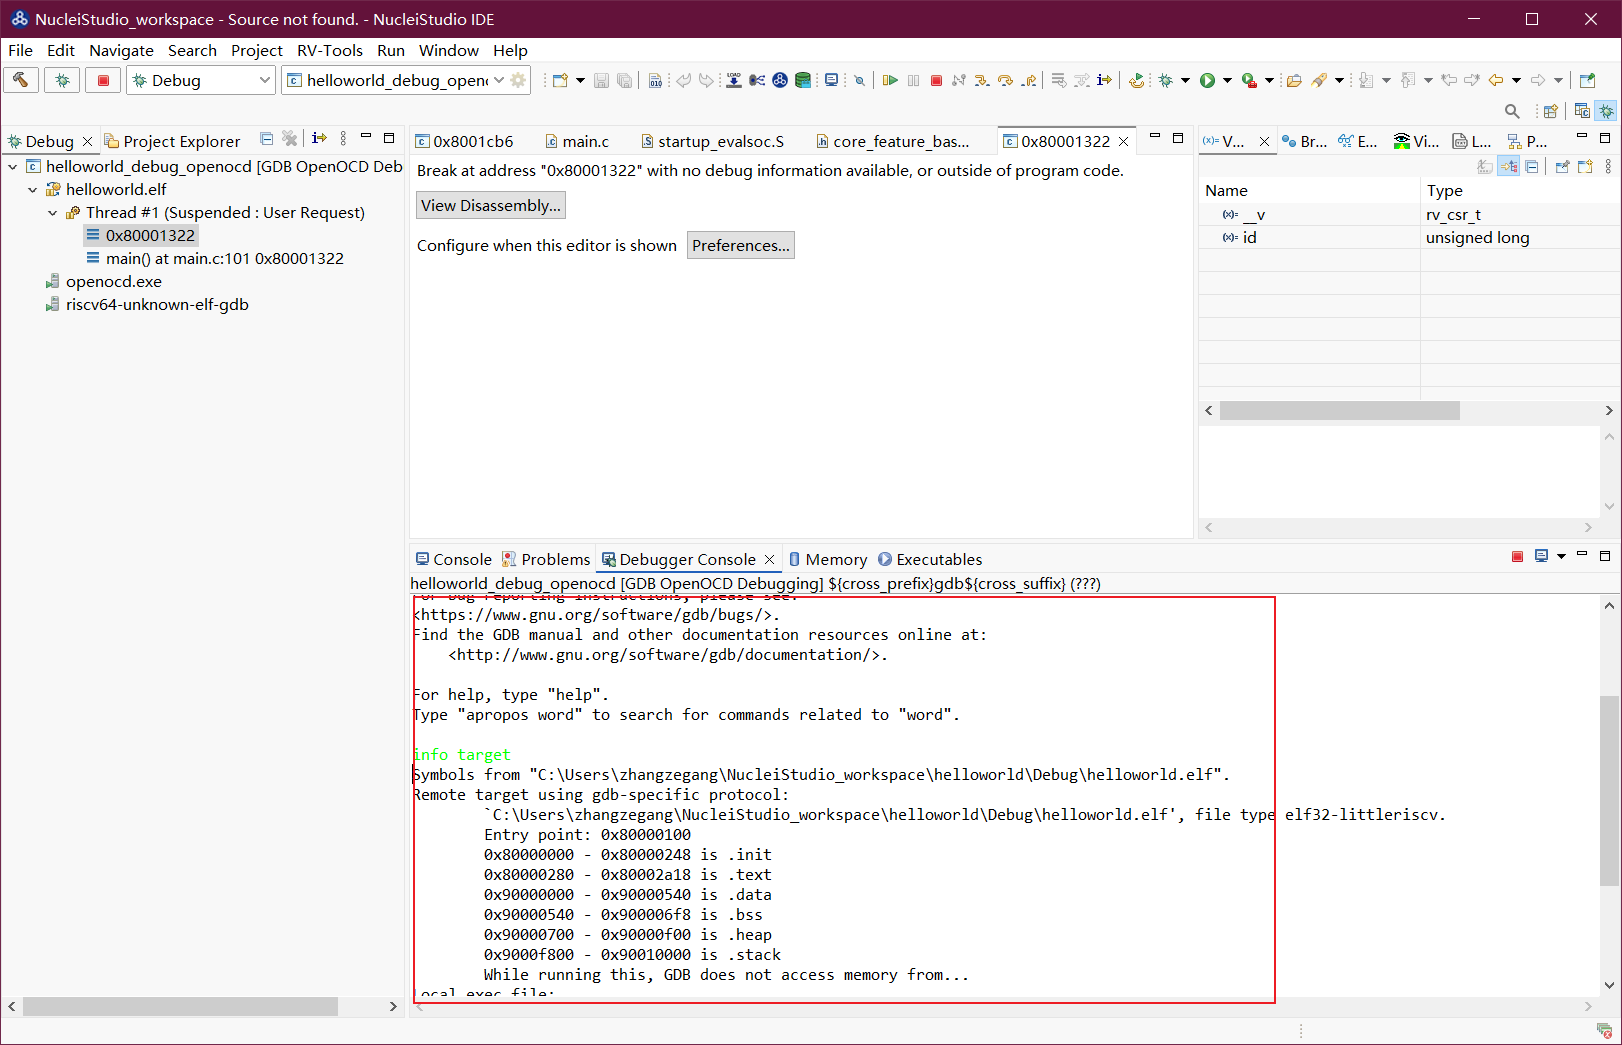
Once the IDE is connected to the development board, you can use the IDE’s Debugger Console tool to send GDB commands to view the board’s current information.
2.9.5.1. Viewing Nuclei CPU Information
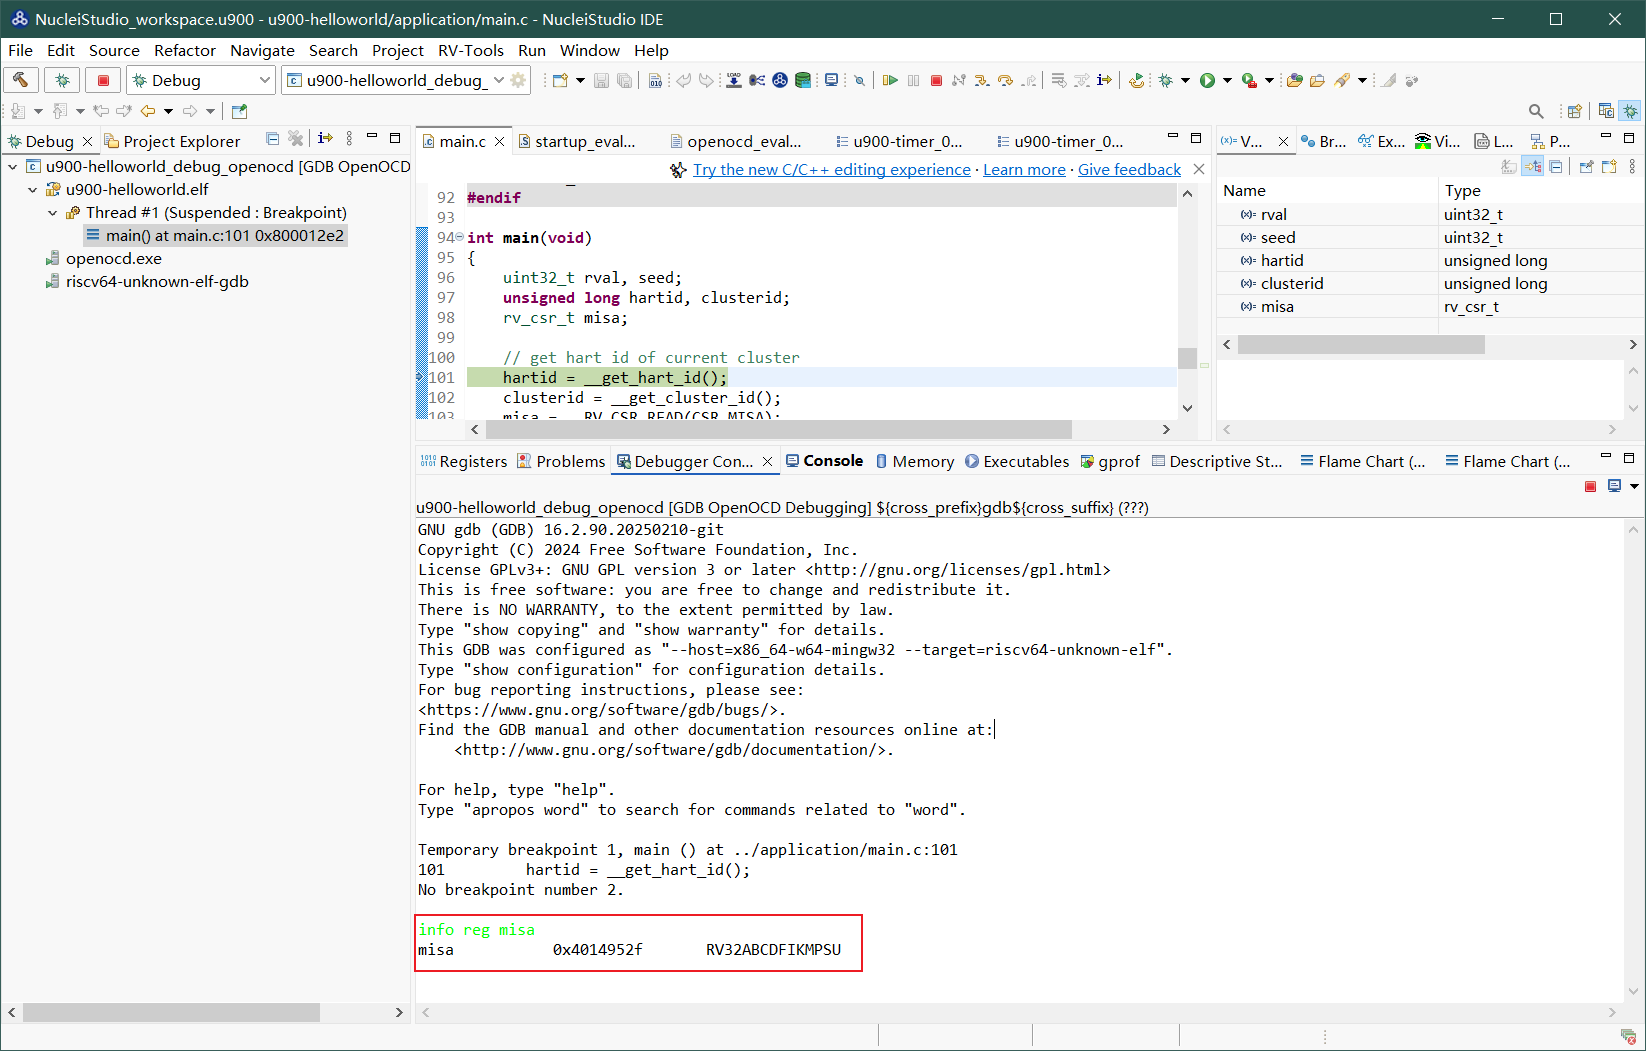
After connecting to the running target, you can send the command info reg misa through the IDE’s Debugger Console tool to view the misa information of the current CPU. The misa value is displayed directly in the Debugger Console.
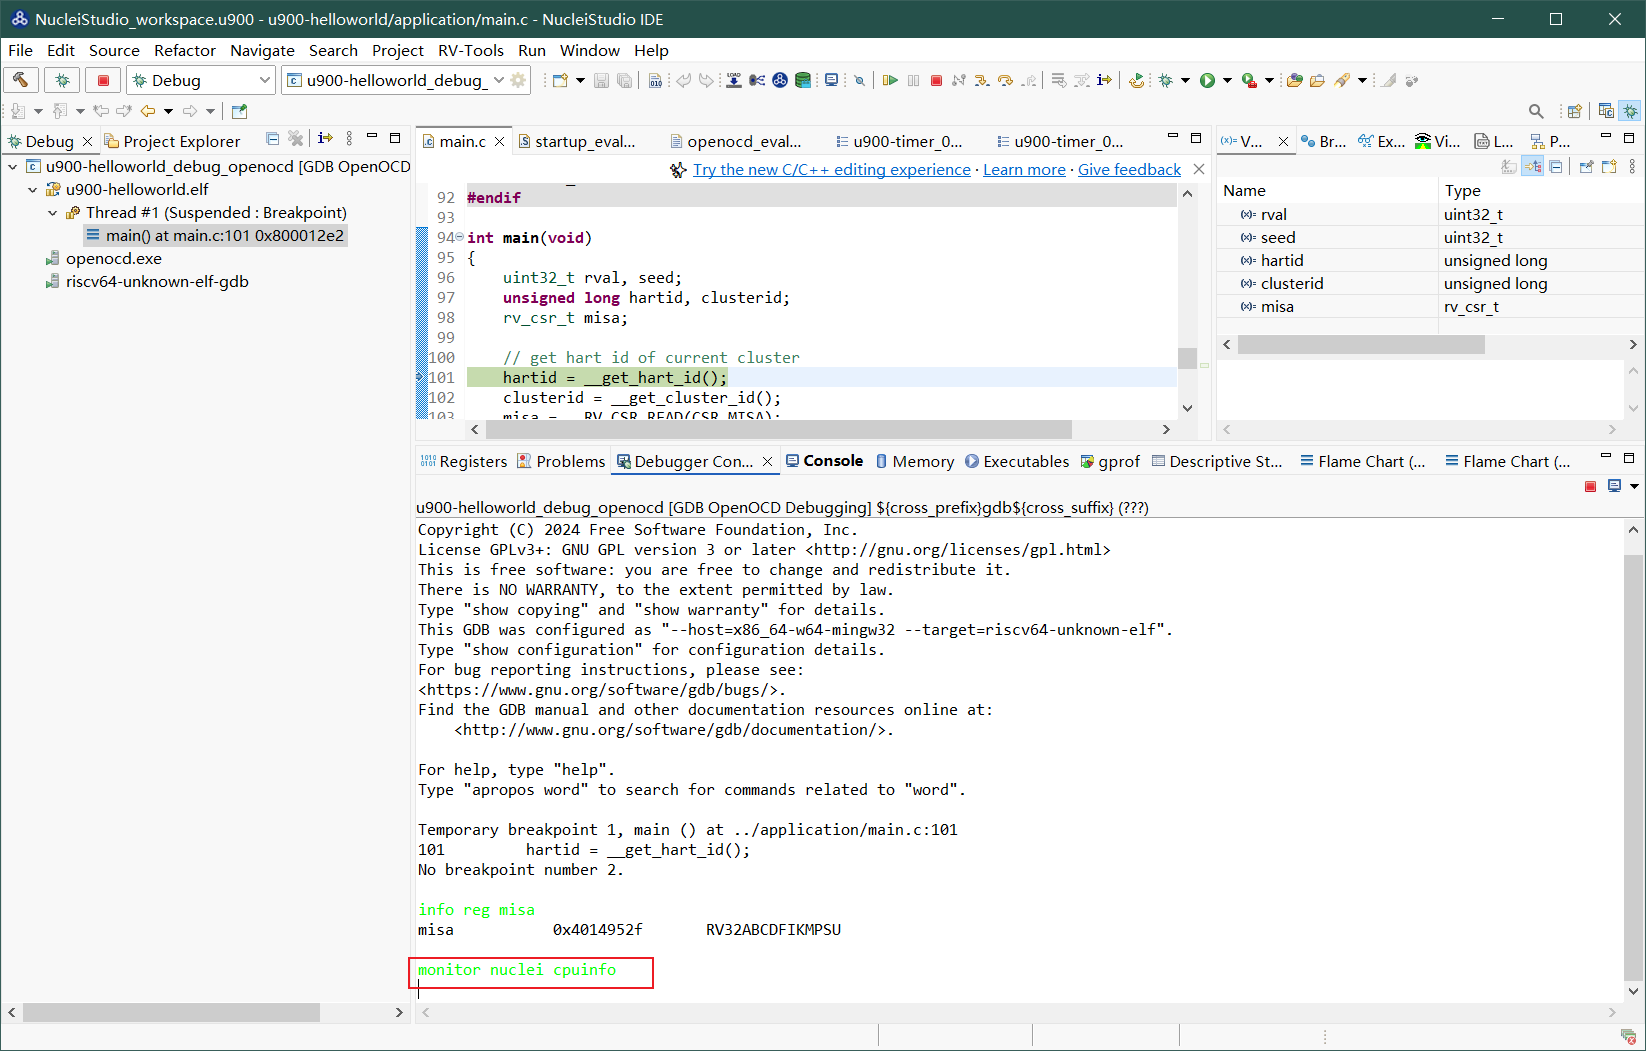
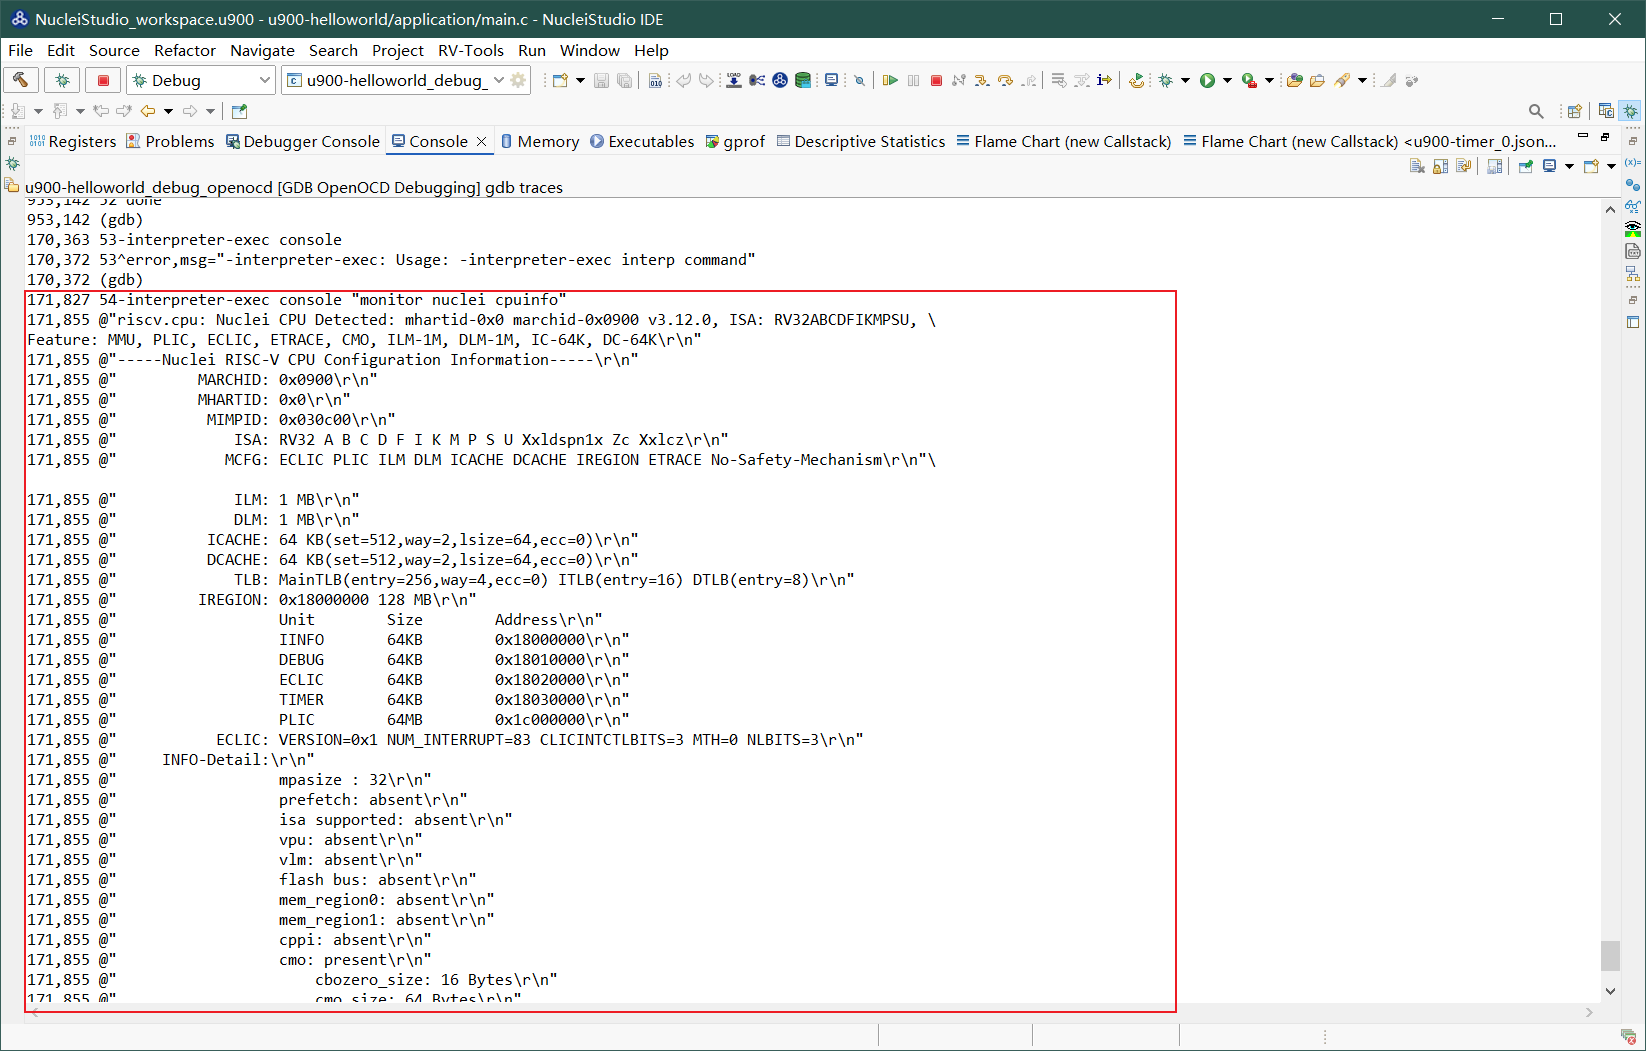
You can also send the command monitor nuclei cpuinfo through the IDE’s Debugger Console tool to view the current Nuclei CPU information. Due to an Eclipse limitation, the Nuclei CPU information may not be displayed in the Debugger Console, but it can be viewed in the gdb trace.
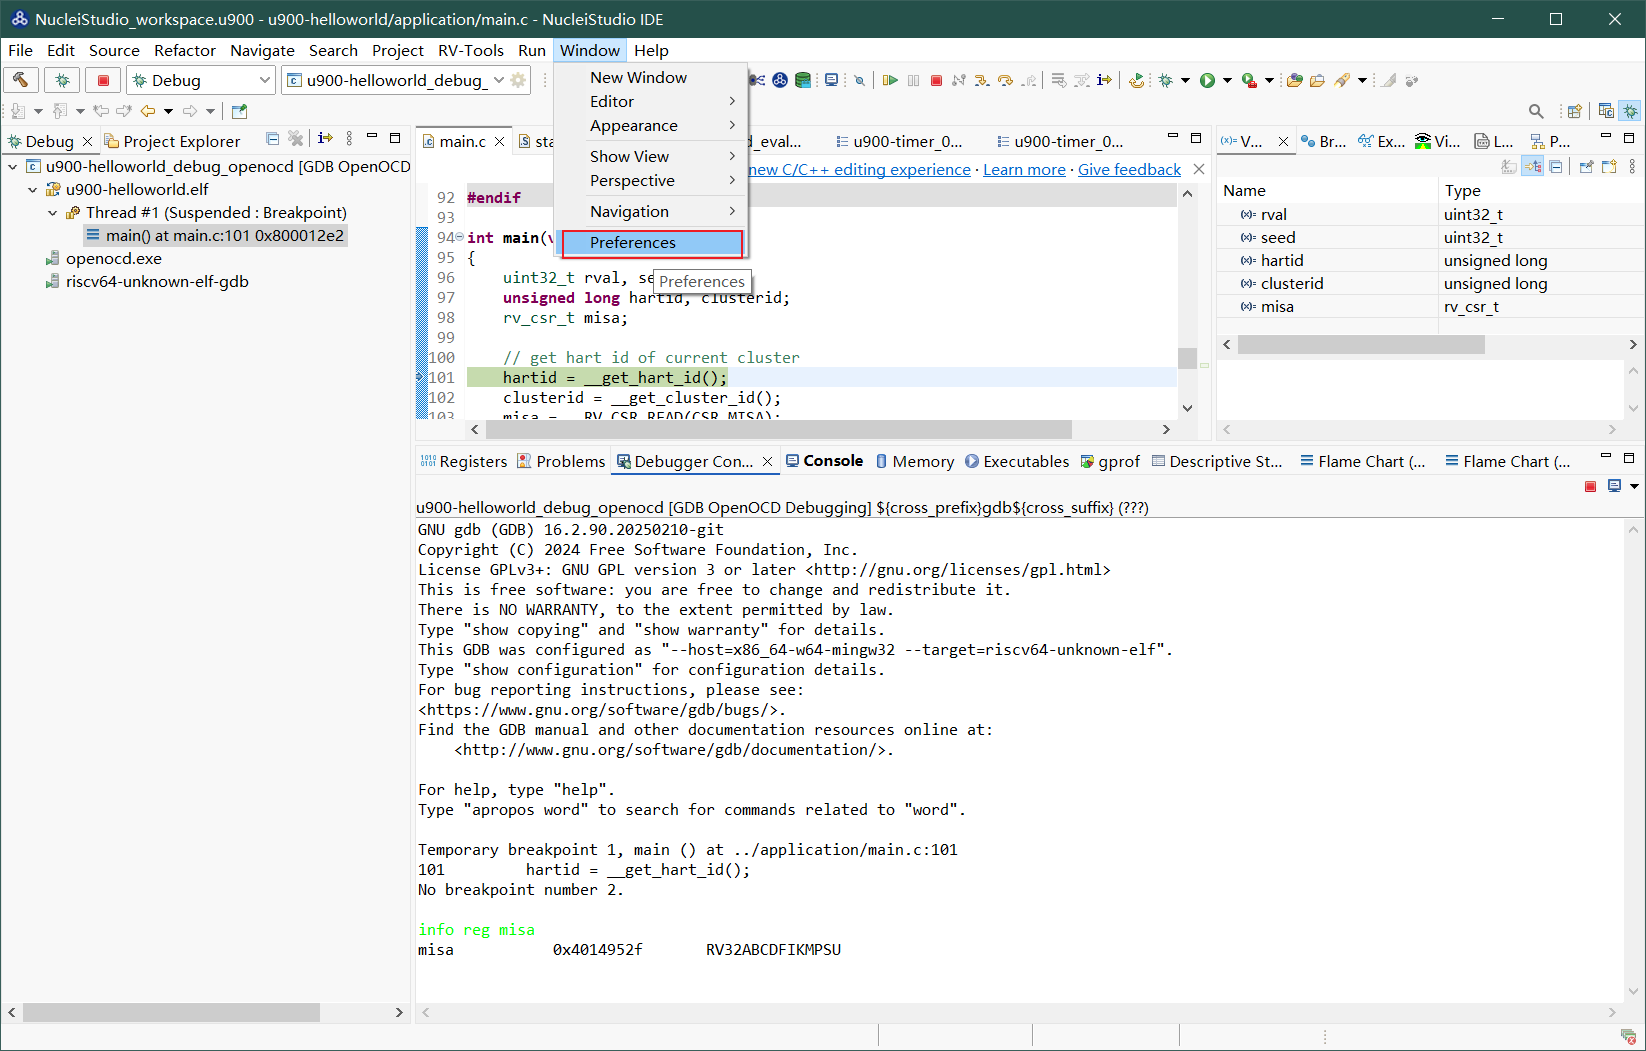
First, enable the gdb trace feature. In Nuclei Studio, open the menu Window -> Preferences.
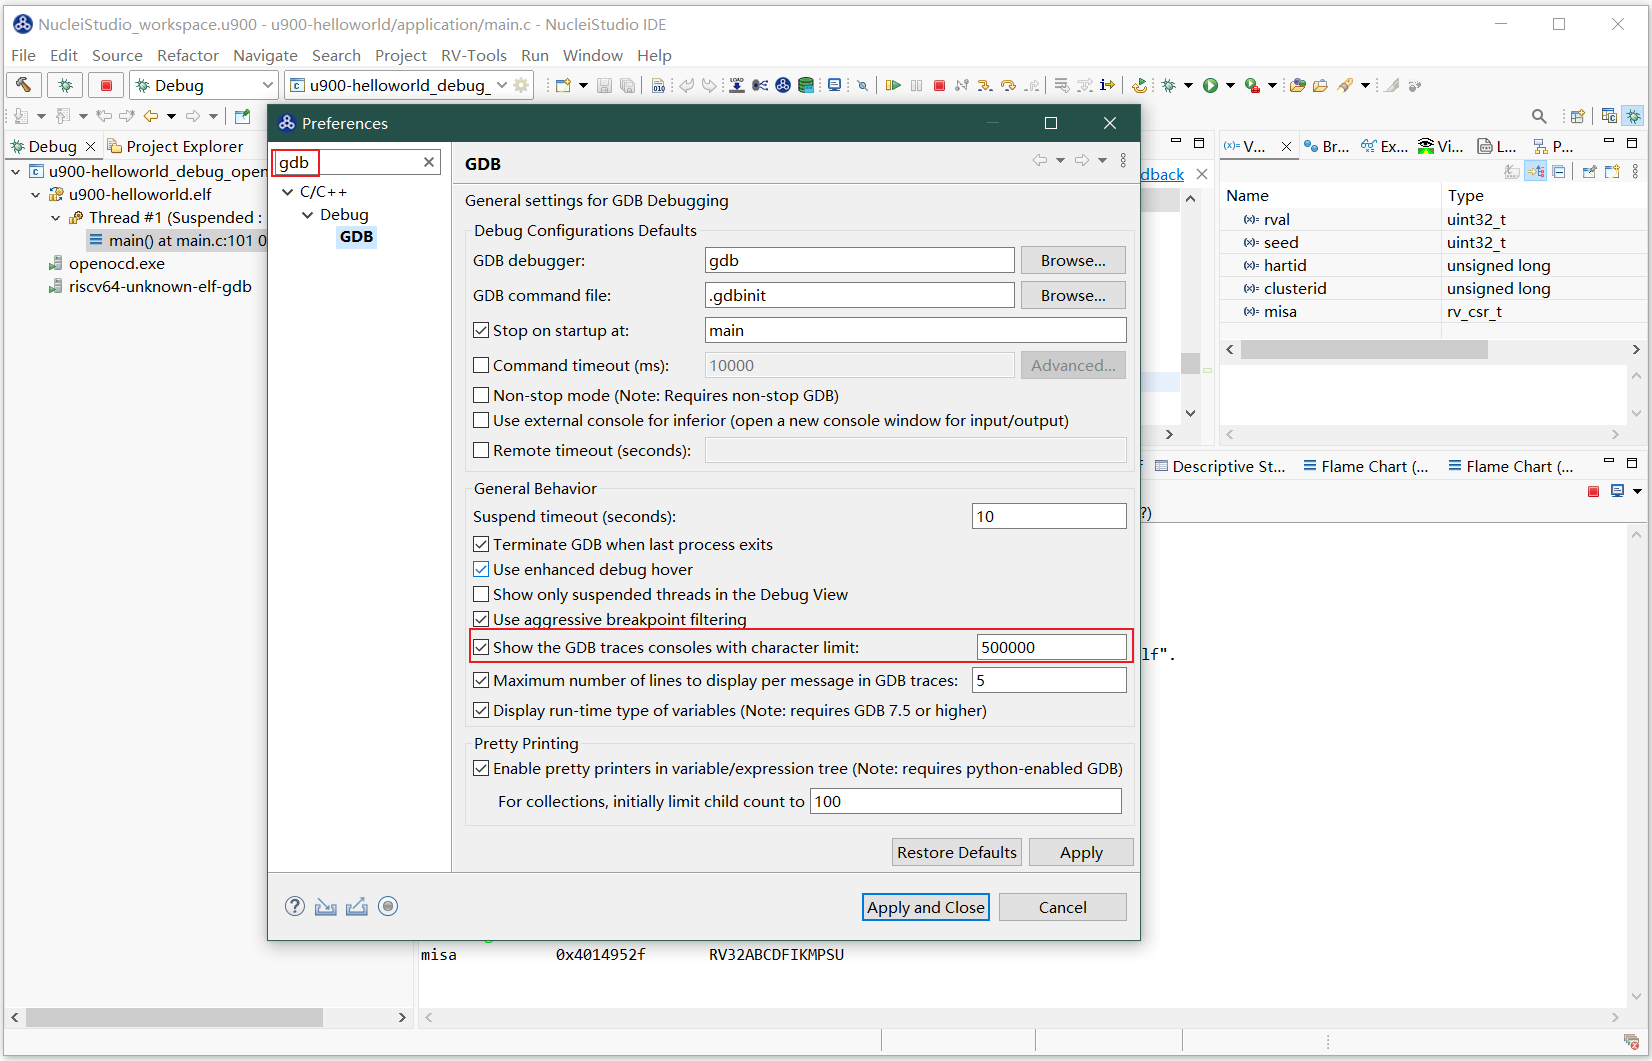
Search for gdb, and in the GDB configuration page, find and check Show the GDB trace console with character limit.
Send the command monitor nuclei cpuinfo through the IDE’s Debugger Console tool.
Then find the gdb trace view in the Console window and open it.
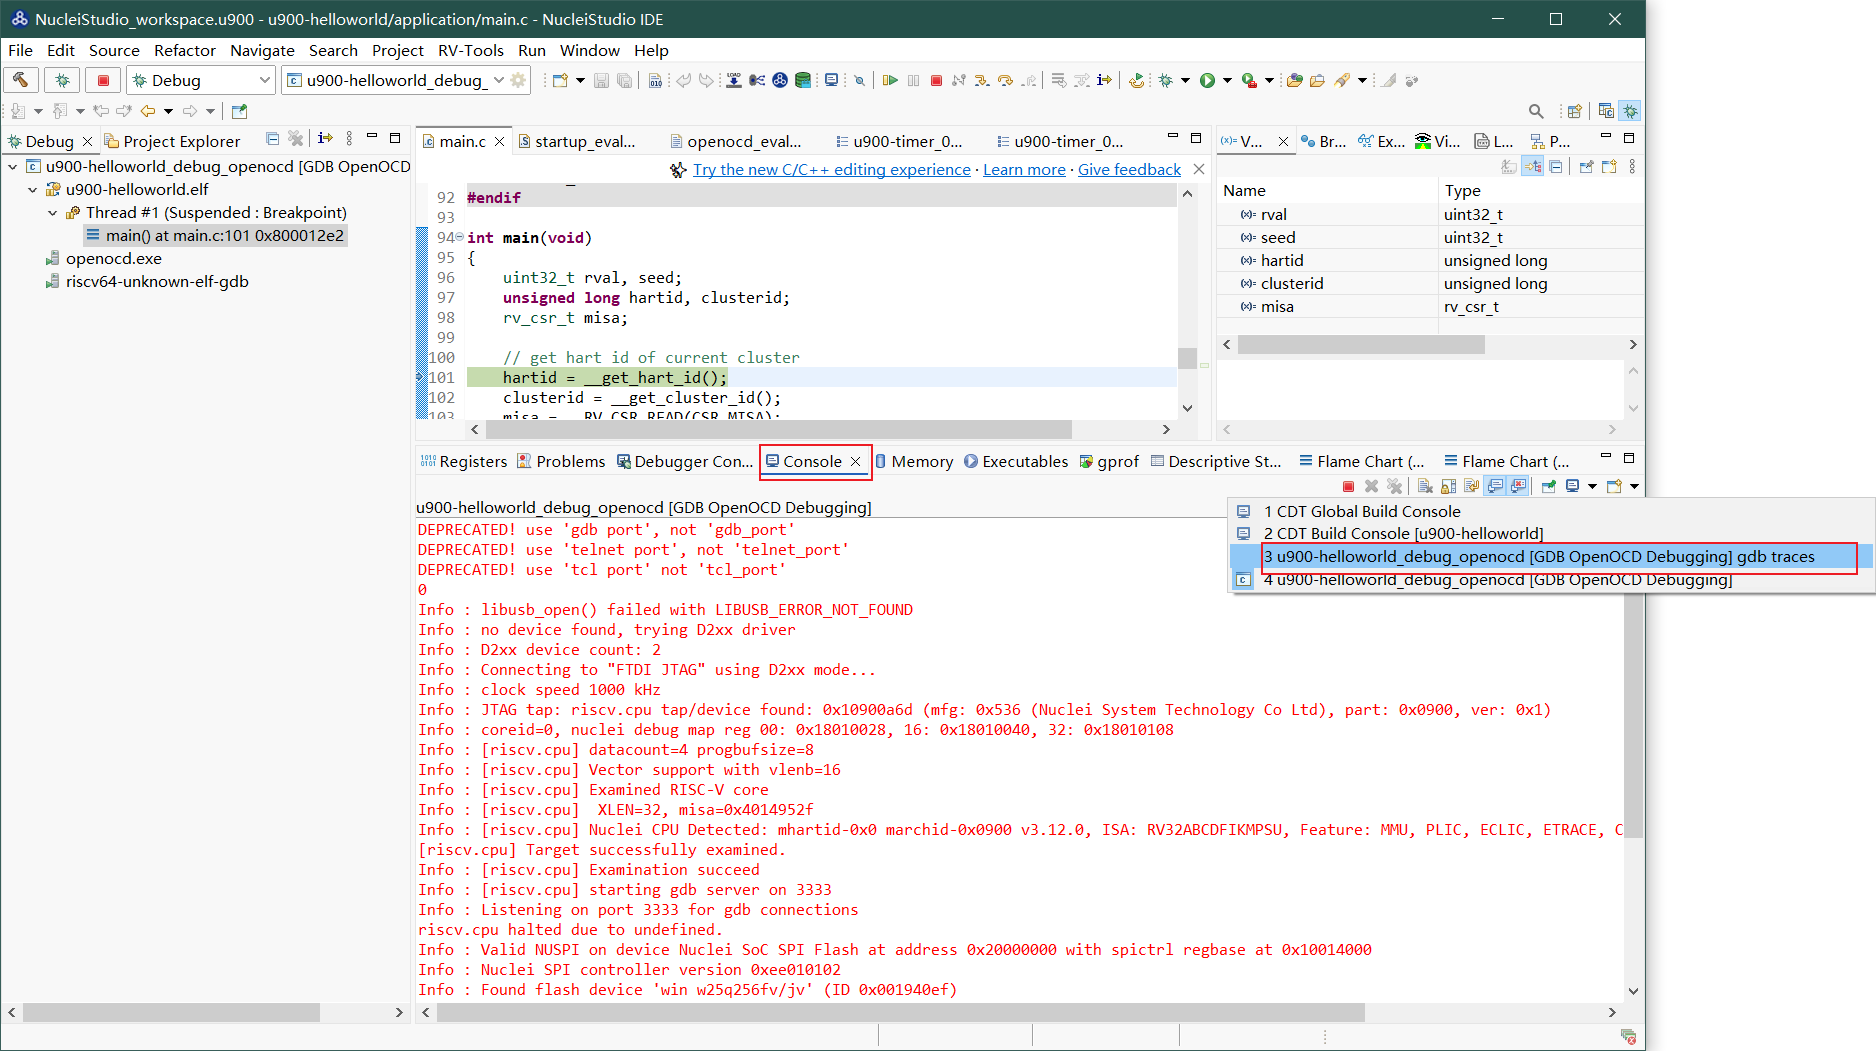
The Nuclei CPU information can be viewed in the gdb trace view.
2.9.6. Flash Programming
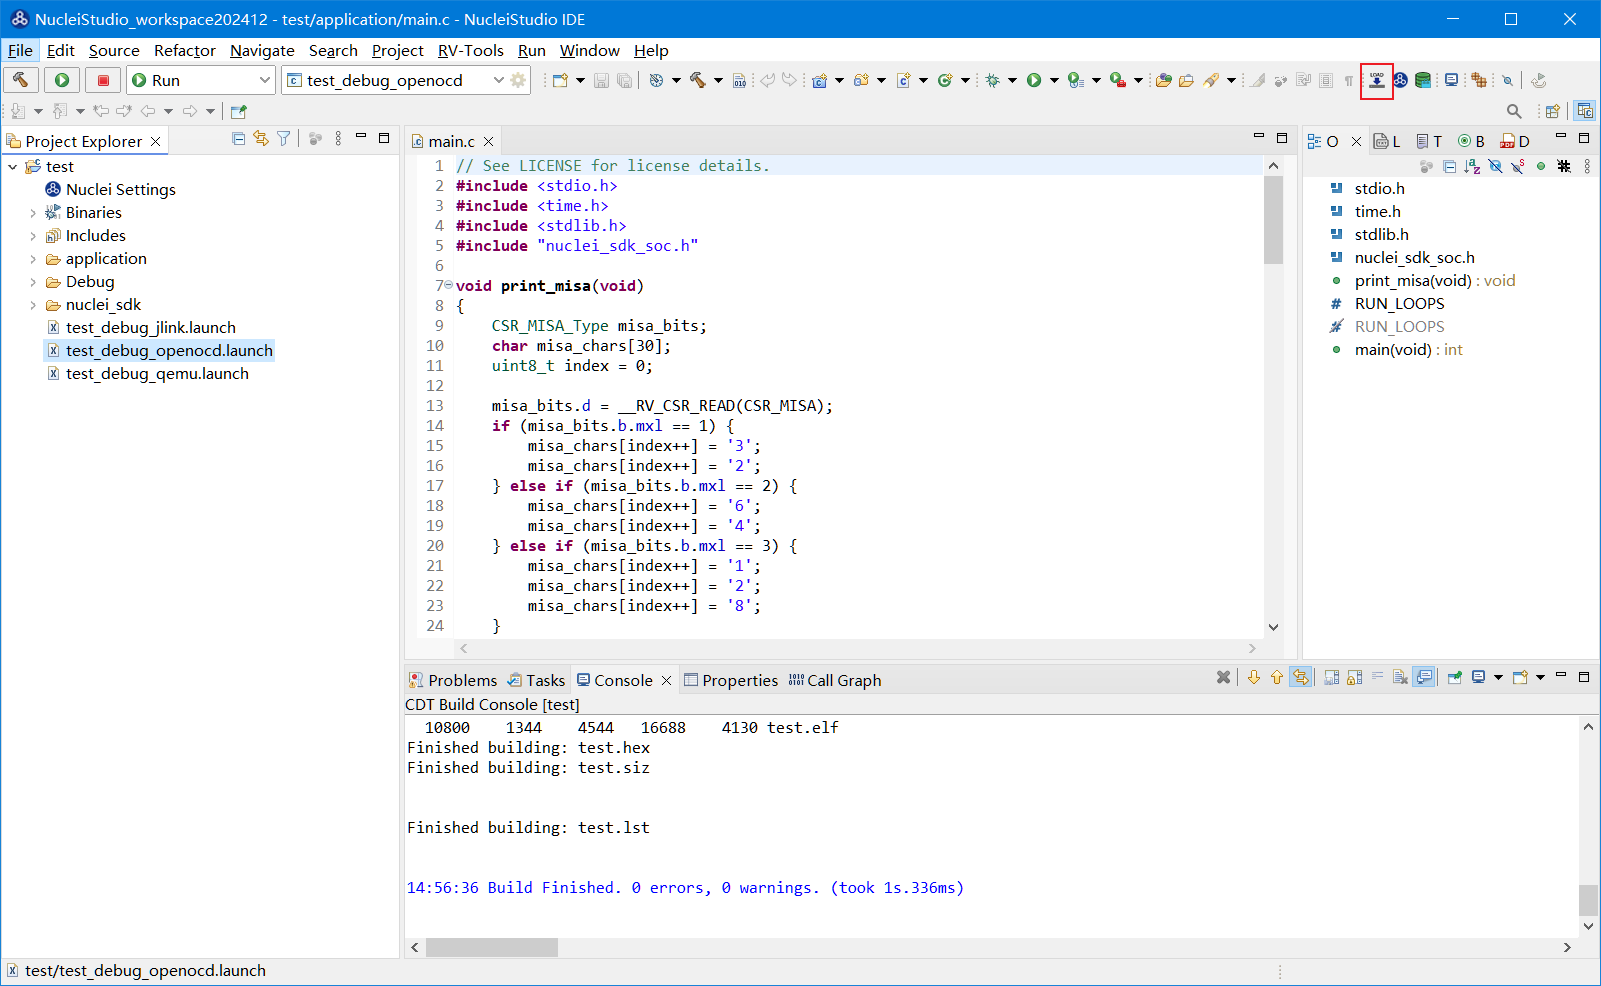
To support downloading compiled binary files directly to a hardware development board, Nuclei Studio provides the Flash Programming feature. This feature lets you download a compiled binary file to a hardware development board quickly and conveniently, greatly improving development and debugging efficiency; it also simplifies the workflow, so that a single click downloads the binary file. After the project is built, find Flash Programming and click it to download the binary file.
You can also modify its related configuration: click the configuration button in the Launch Bar to open the configuration page, and then select the Flash Programming tab.
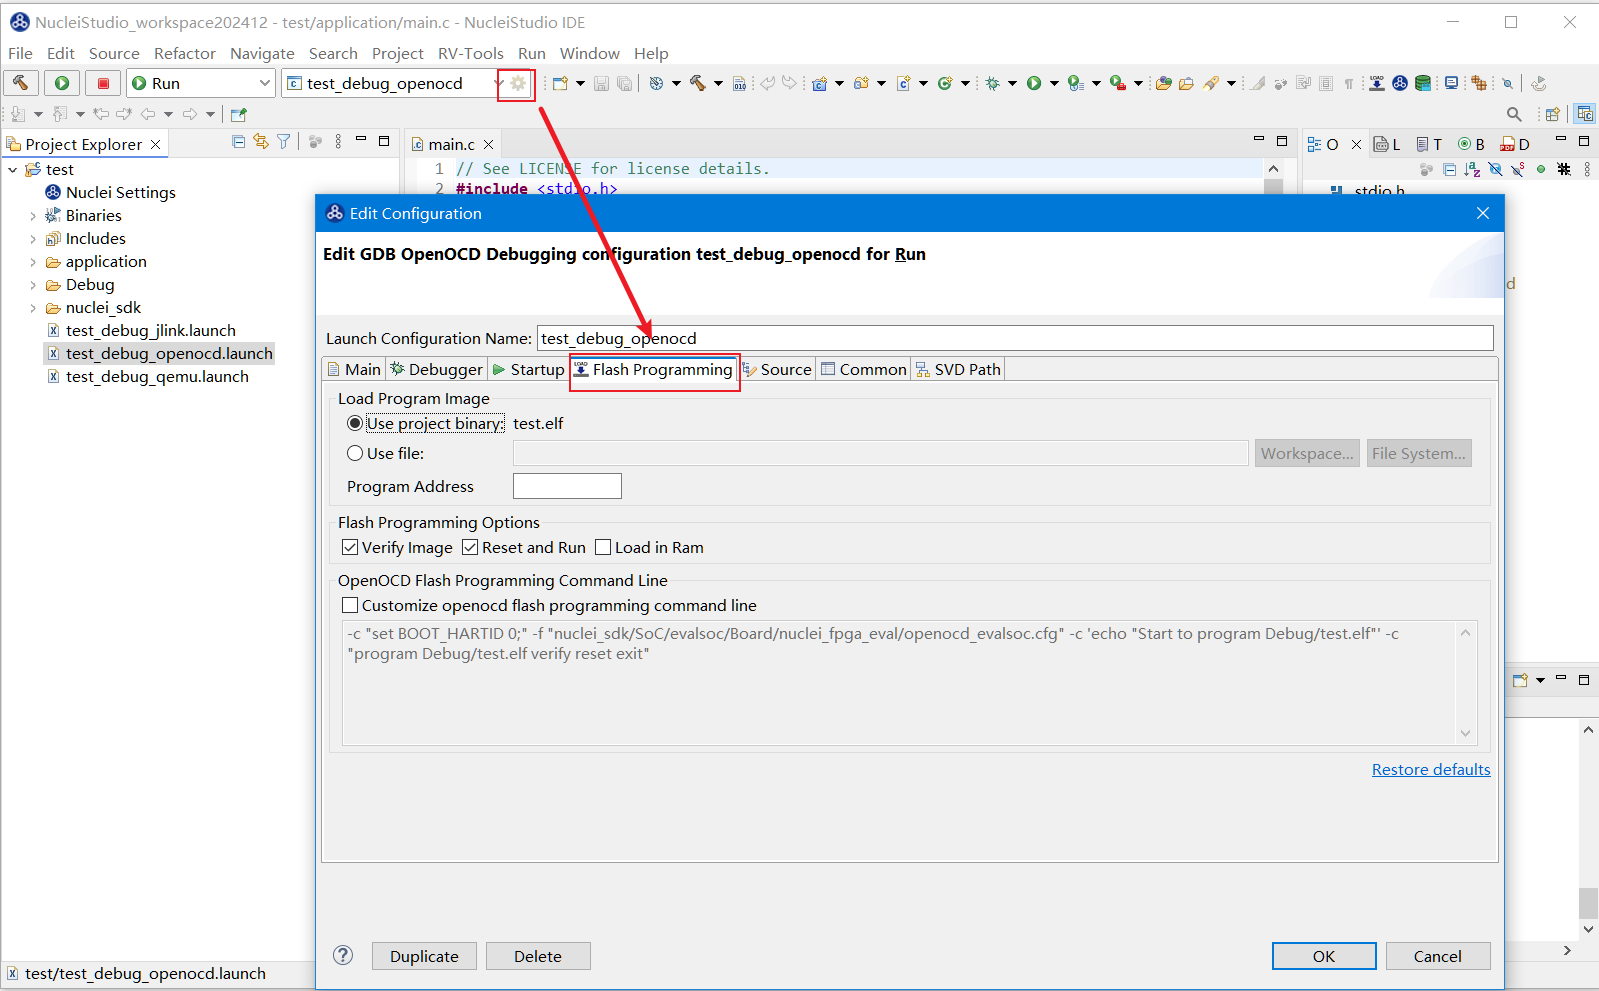
Load Program Image
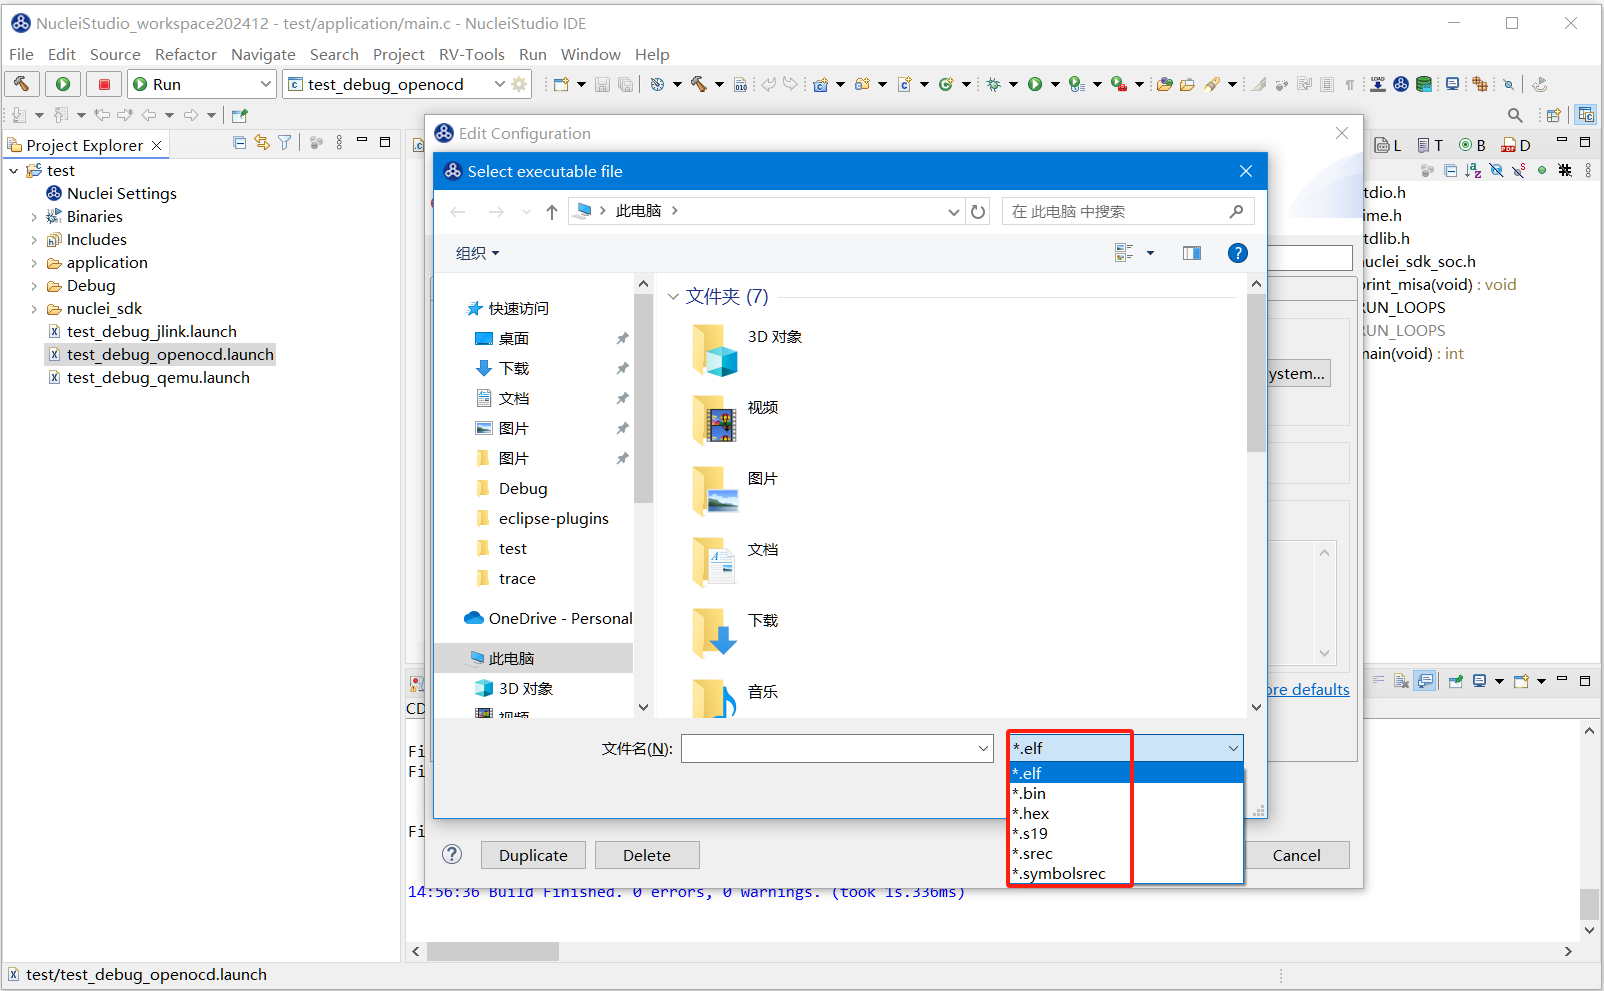
The file to load. ELF format is used by default, and various other formats are supported, such as *.bin, *.hex, *.s19, *.srec, *.symbolsrec.
Flash Programming Options
Three Flash Programming options are available:
Verify Image: After programming completes, verifies that the programmed image matches the file on the currently connected target device, to ensure that programming succeeded.
Reset and Run: After programming completes, resets the CPU and runs it. Note that if Load in RAM is checked, the CPU only runs without a reset (a reset would erase a program loaded into RAM).
Load in Ram: When checked, the firmware is downloaded to memory instead of non-volatile storage such as Flash. When selected, the Program Address must be specified.
Note
The firmware download method and the OpenOCD commands used differ depending on whether
Load in Ramis checked. This is described in detail later in this document; read it carefully and choose correctly according to your actual situation.
These parameters correspond to the project’s Download mode. Nuclei Studio supports DDR/ILM/SRAM/FLASH/FLASHXIP by default.
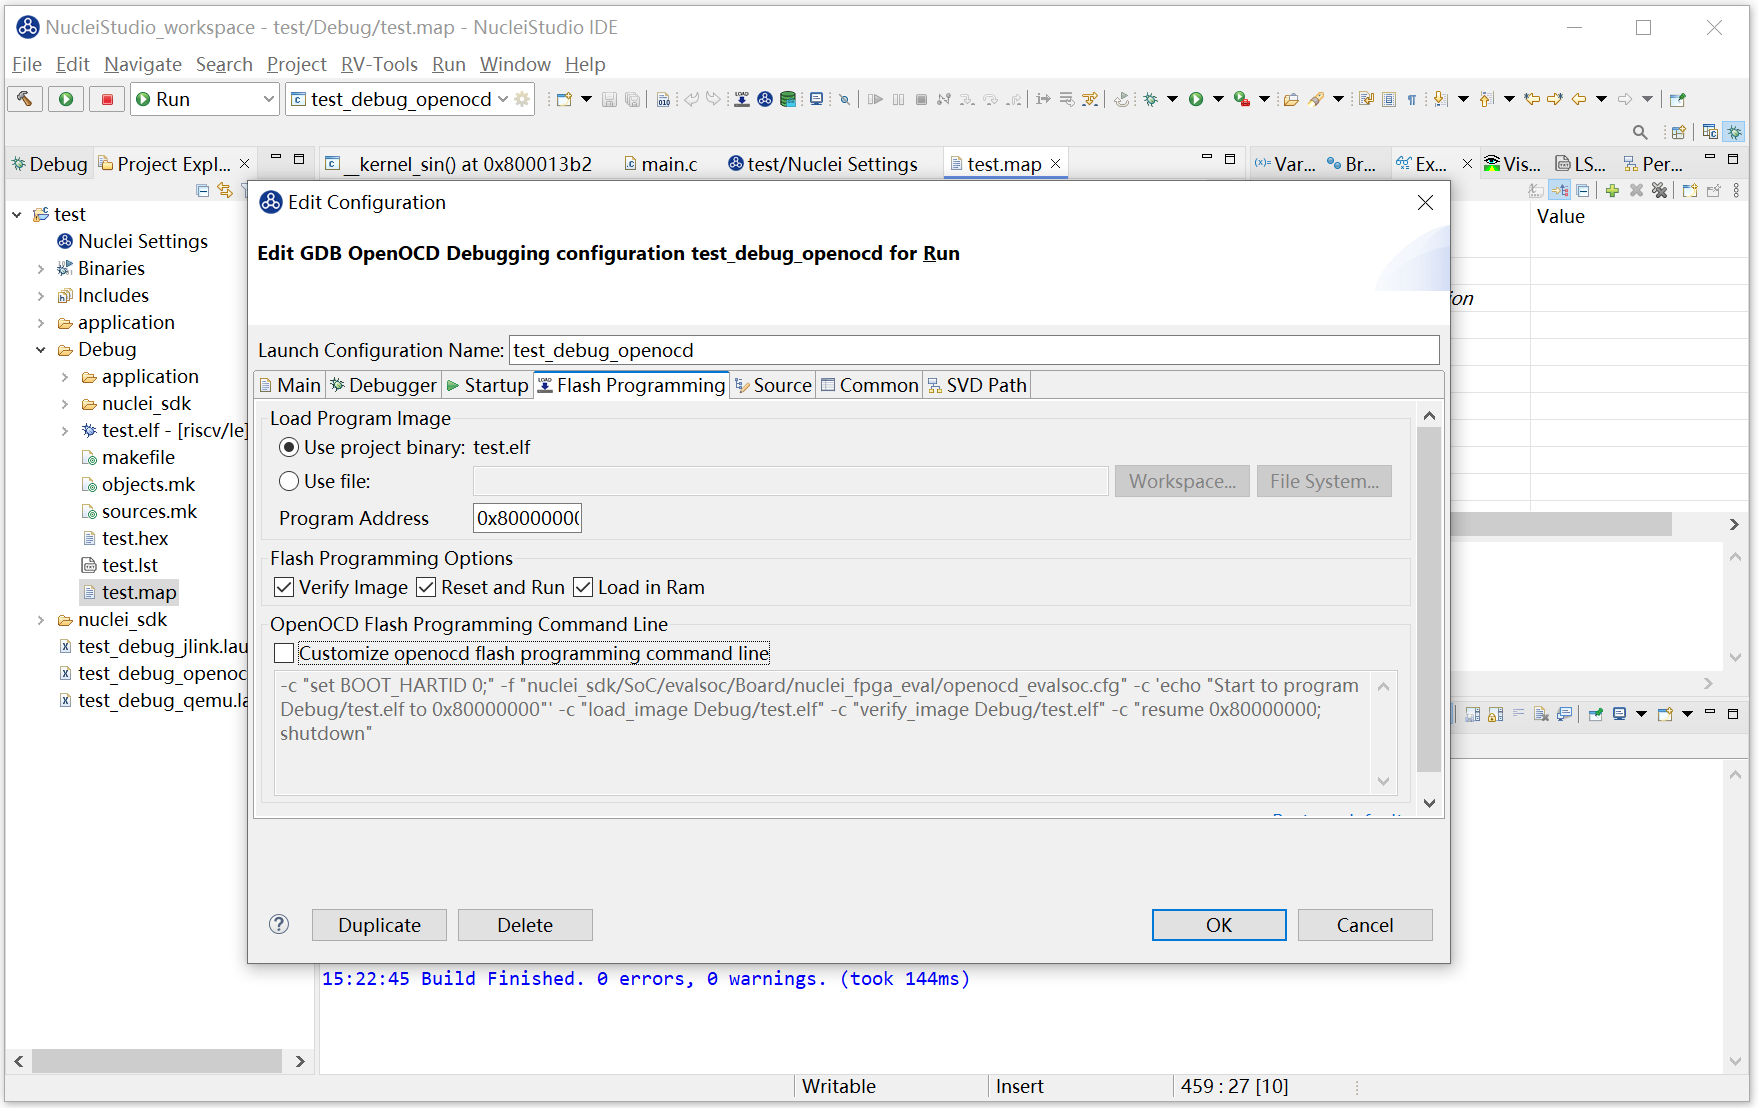
When the project’s Download mode is DDR/ILM/SRAM, Load in Ram must be checked, and the Program Address must not be empty. The Program Address here is the first address where the program is loaded into RAM.
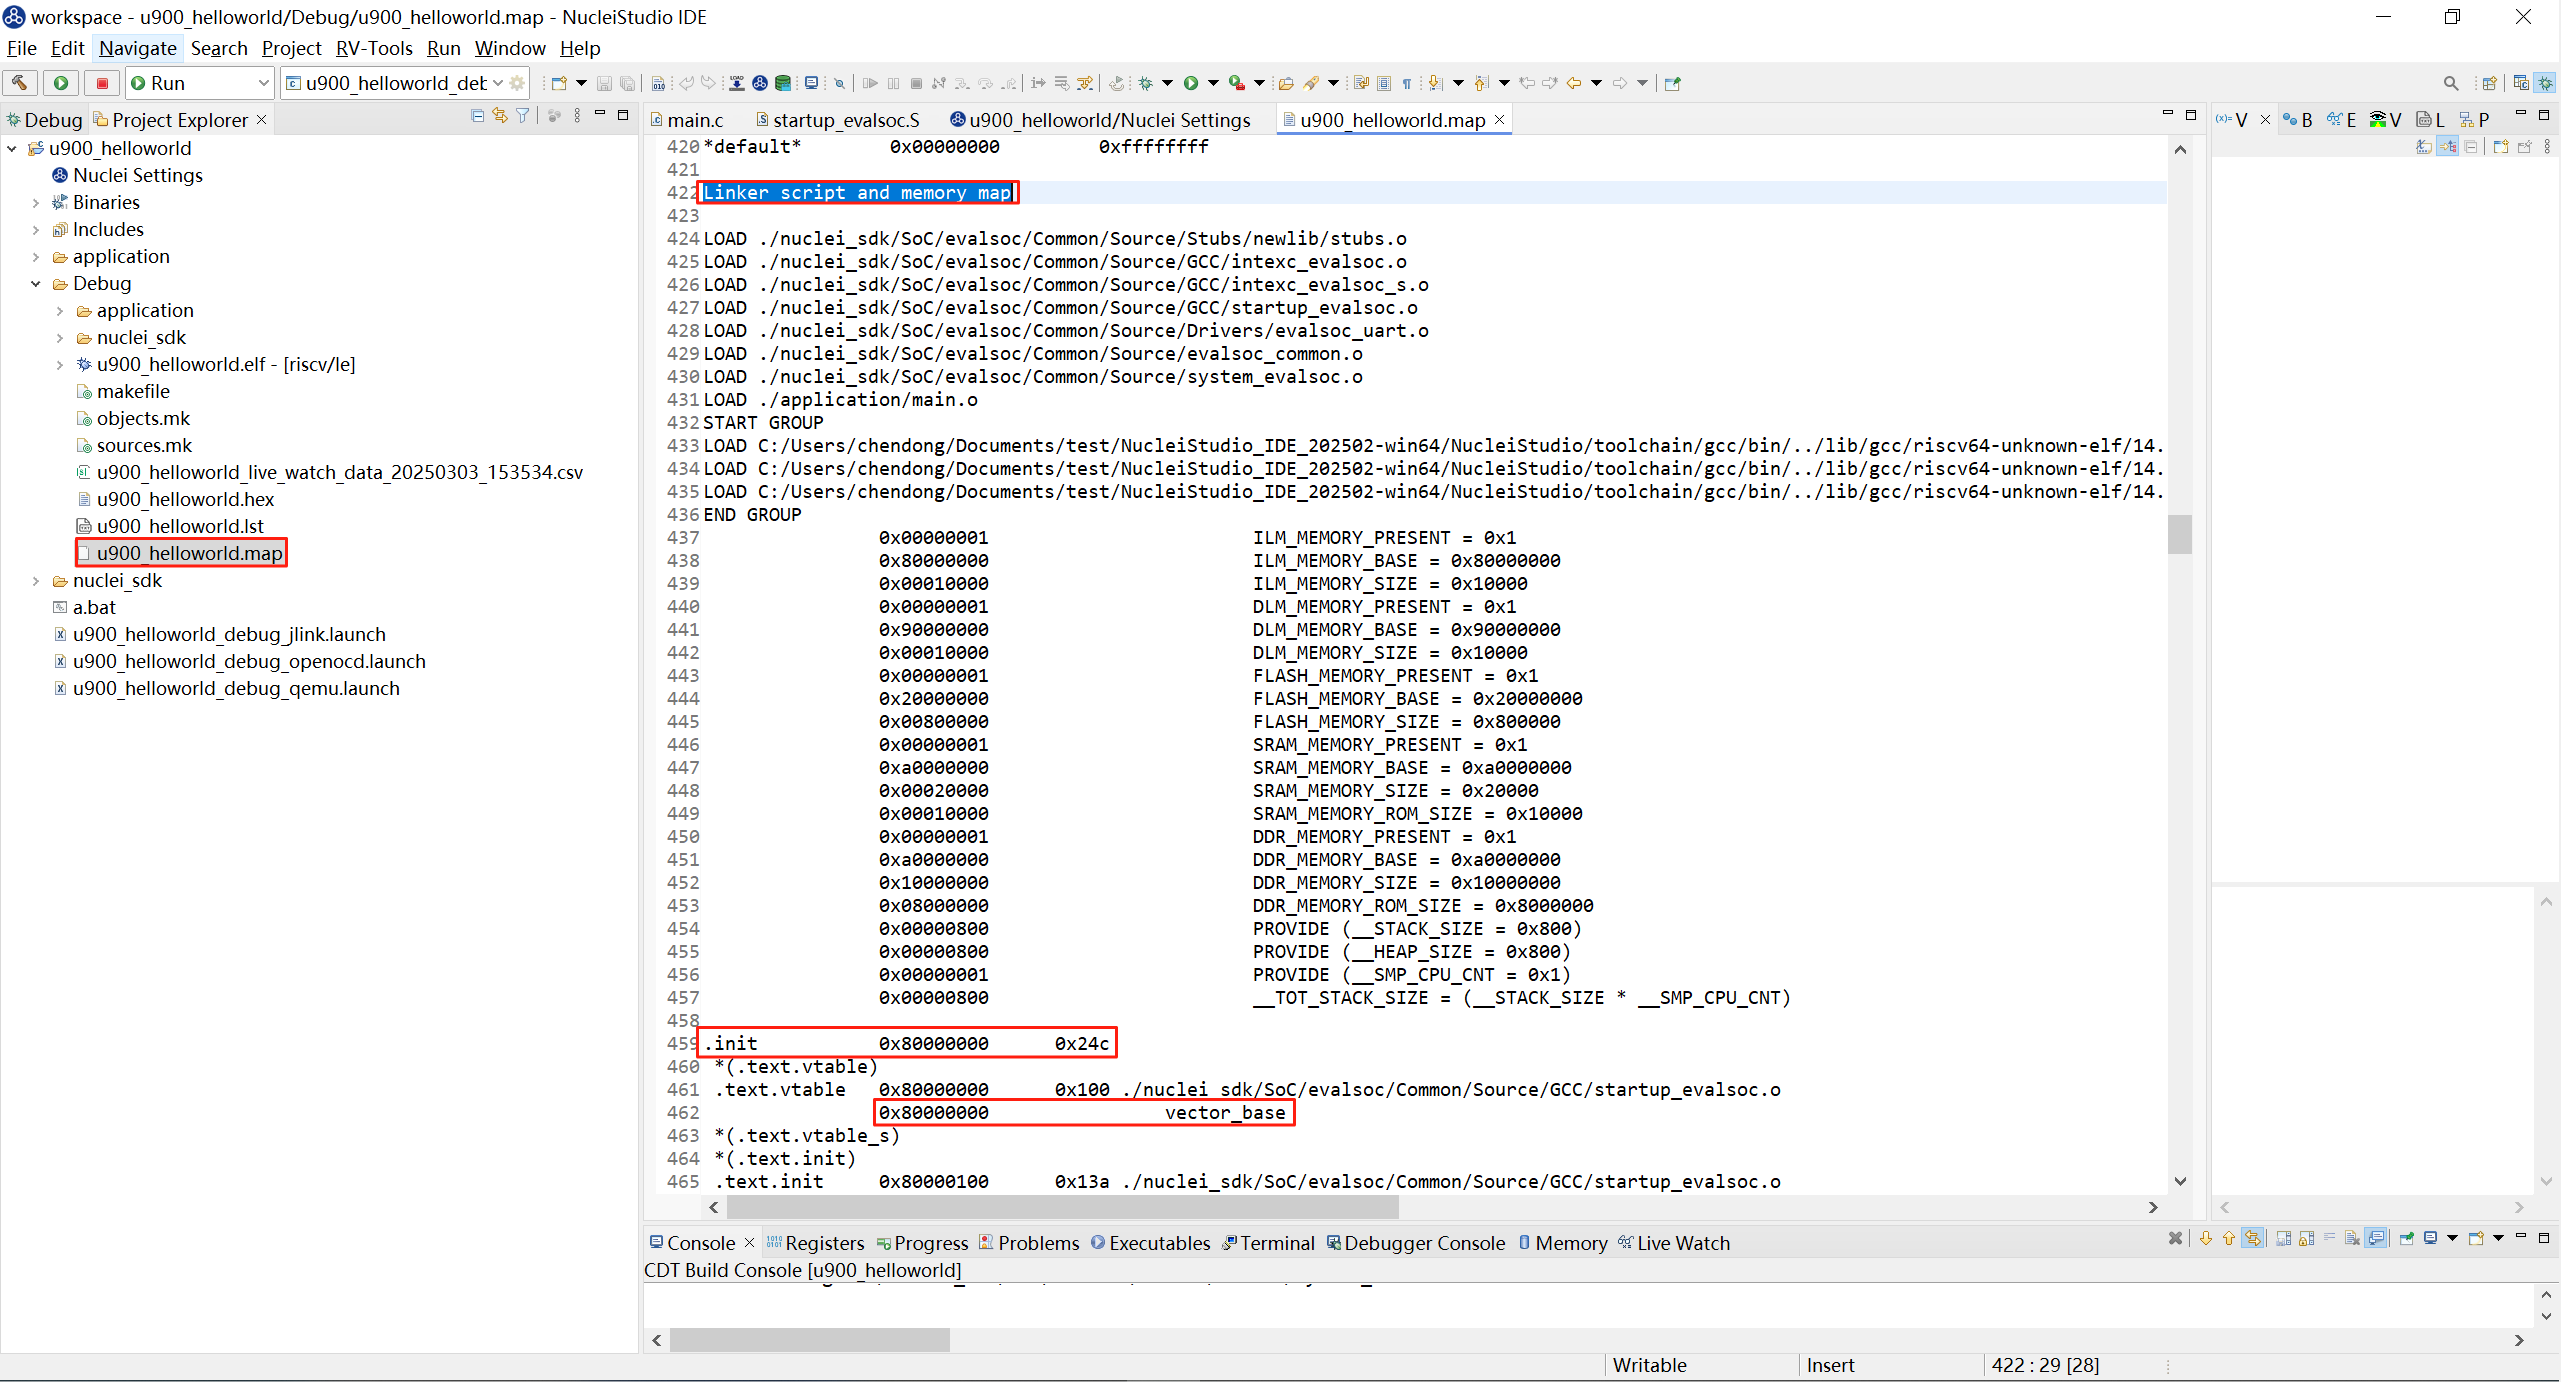
In general, the Program Address can be found in the *.map file, or by running riscv64-unknown-elf-readelf -h /path/to/your.elf and checking the Entry point address. This document only describes how to find the Program Address from the *.map file.
Open the *.map file, search for Linker script and memory map, and find the address after .init; that address is the Program Address.
When Load in Ram is selected together with Verify Image, an extra command -c "verify_image Debug/test.elf" appears in the command line; in this case, the image check is implemented through the verify_image command.
When Load in Ram is selected together with Reset and Run, an extra command -c "resume 0x80000000; shutdown" appears in the command line; in this case, the system may be forcibly reset after loading through the resume command.
-c "set BOOT_HARTID 0;"
-f "nuclei_sdk/SoC/evalsoc/Board/nuclei_fpga_eval/openocd_evalsoc.cfg"
-c 'echo "Start to program Debug/test.elf to 0x80000000"'
-c "load_image Debug/test.elf"
-c "verify_image Debug/test.elf"
-c "resume 0x80000000; shutdown"
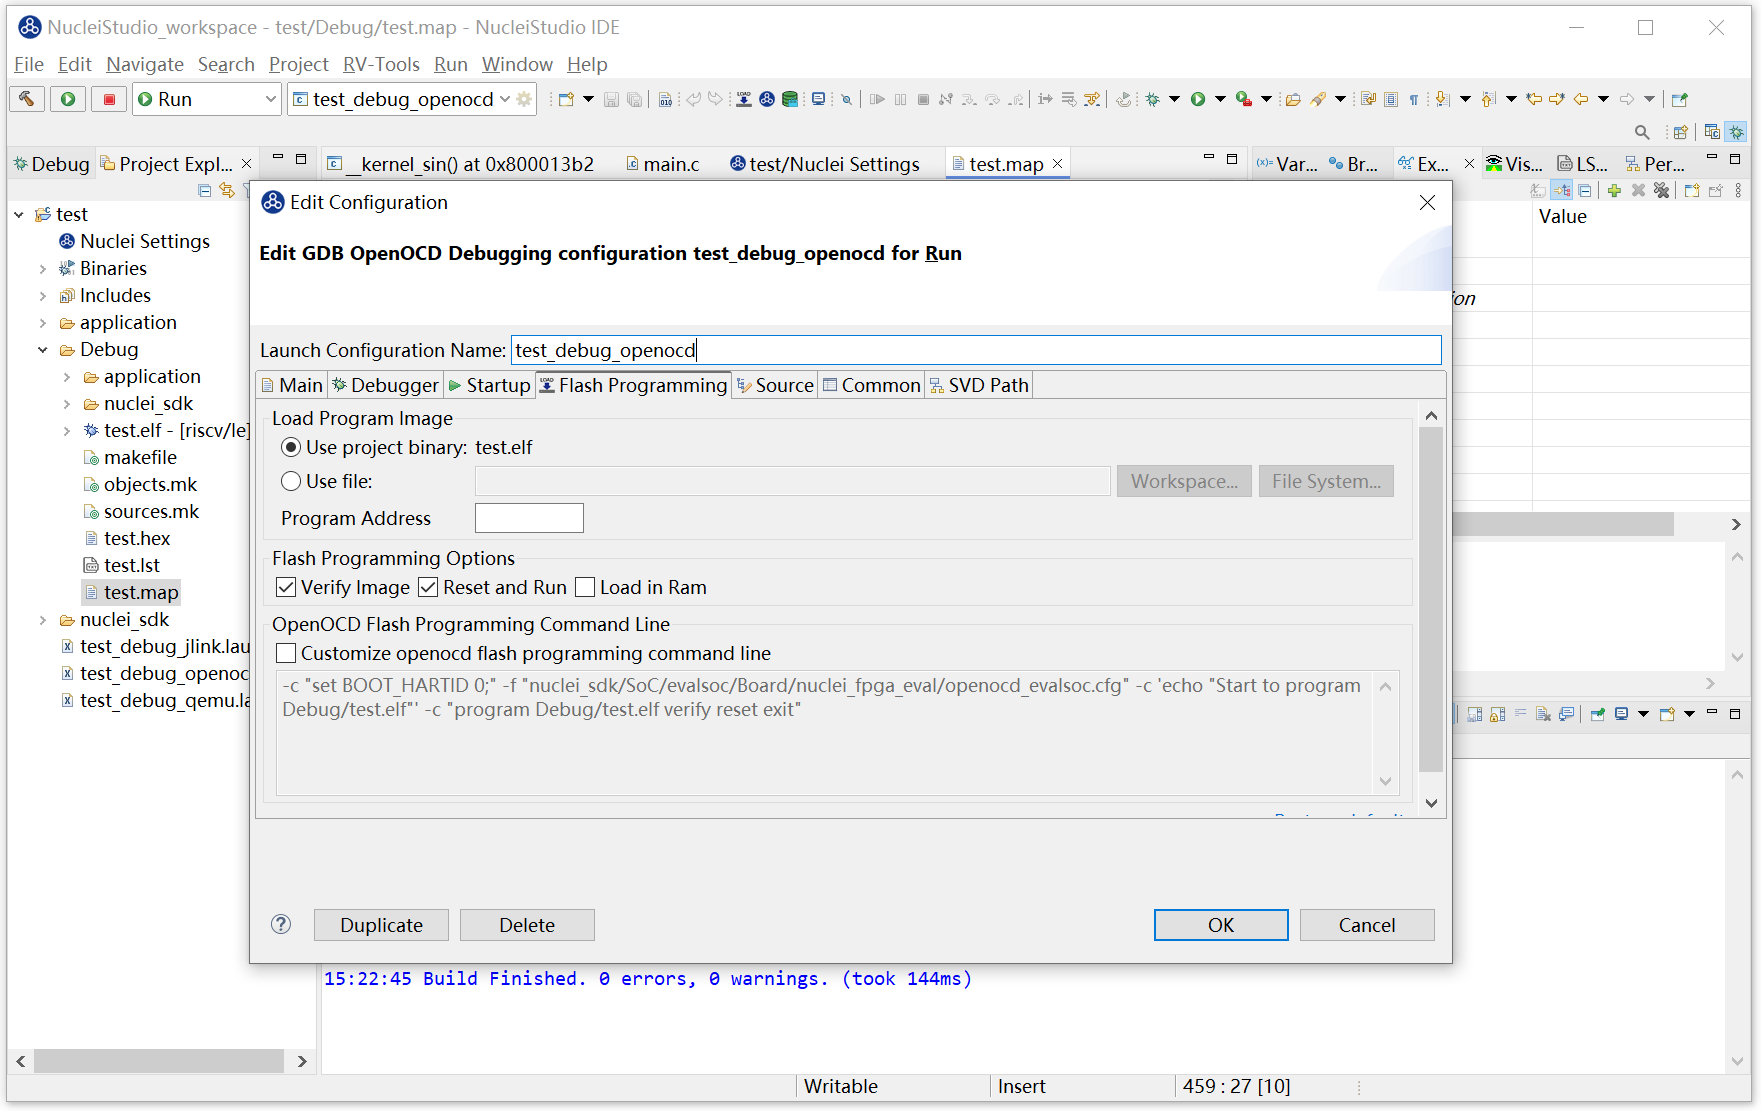
When the project’s Download mode is FLASH/FLASHXIP, Load in Ram is not checked, and the Program Address must be empty.
When Verify Image is selected, an extra command verify appears in the command line; in this case, the image check is implemented through the verify command.
When Reset and Run is selected, an extra command reset appears in the command line; in this case, the system may be forcibly reset after loading through the reset command.
-c "set BOOT_HARTID 0;"
-f "nuclei_sdk/SoC/evalsoc/Board/nuclei_fpga_eval/openocd_evalsoc.cfg"
-c 'echo "Start to program Debug/test.elf"'
-c "program Debug/test.elf verify reset exit"
OpenOCD Flash Programming Command line
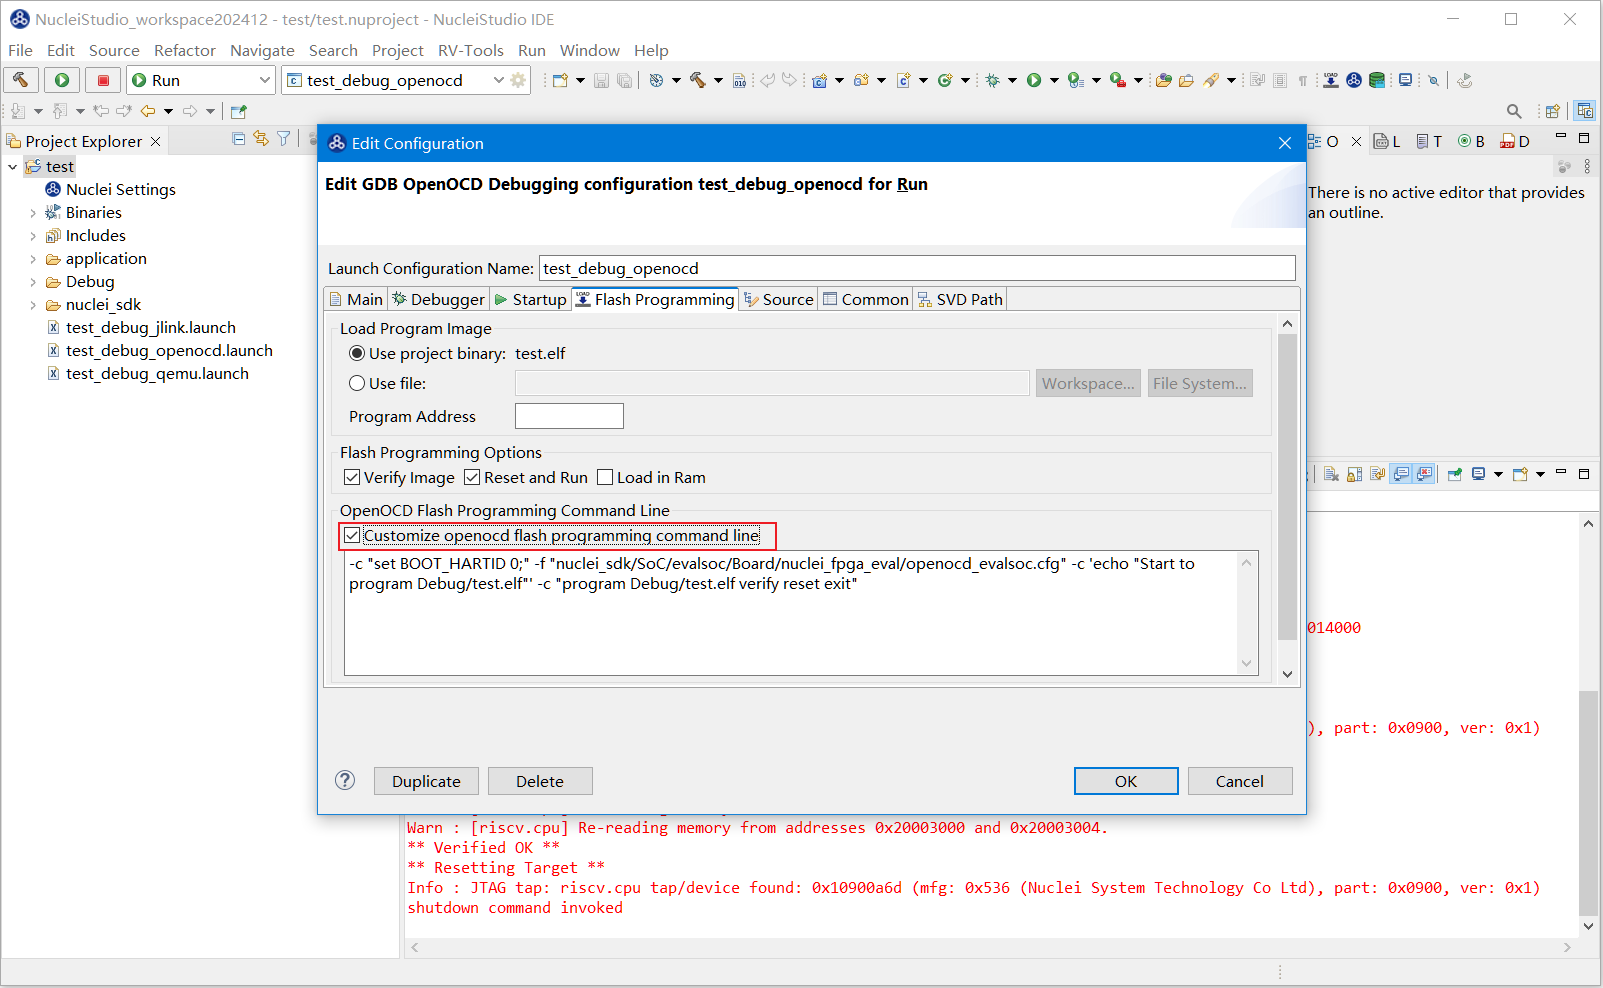
The Flash Programming parameters are ultimately executed through OpenOCD. By default, the Customize openocd flash programming command line option is unchecked. When you check Customize openocd flash programming command line, all other related options are disabled, and you can directly enter a custom command in the input box below.
If you are familiar with OpenOCD commands, you can customize the command to meet specific needs. However, if you are not familiar with OpenOCD command-line operations, leave this option unchecked to avoid configuration errors.
After configuring the parameters as needed, click Flash Programming to download the binary code to the hardware. A successful download result is shown below.
