2.12. Nuclei Studio FAQ
2.12.1. Nuclei Studio Starts Slowly
Nuclei Studio is built on Eclipse. While it inherits Eclipse’s extensibility, it also suffers from slow startup: on the first launch, the IDE must verify the environment, generate commonly used cache files, and create the workspace. Startup was optimized in Nuclei Studio 2021.09; with adequate hardware, the first launch of Nuclei Studio completes within one minute.
Recommended environment for Nuclei Studio:
Windows 10 operating system
More than 4 GB of memory (2 GB allocated to Nuclei Studio)
2.12.2. Nuclei Studio Builds Programs Slowly
During testing, we found that Nuclei Studio builds projects very slowly when 360 antivirus software is installed; after exiting the 360 antivirus software, builds run at normal speed. To ensure Nuclei Studio works normally, exit antivirus software such as 360 while using it.
2.12.3. Cannot Find the New Nuclei RISC-V C/C++ Project Menu
The New Nuclei RISC-V C/C++ Project menu is the quick entry point for creating projects, but it may sometimes not appear.

Reset the perspective via the menu Window -> Perspective -> Reset Perspective, and New Nuclei RISC-V C/C++ Project will reappear.

Alternatively, switch the current perspective to the C/C++ perspective.

2.12.4. Opening/Closing the Launch Bar
Nuclei Studio 2022.12 and later enables the Launch Bar by default. To close the Launch Bar, open Window -> Preferences, search for bar, and uncheck the first option. Check the option again to re-enable the Launch Bar.

2.12.5. Using the Launch Bar
The Nuclei Studio Launch Bar (the part marked by the blue box in the figure below) builds, debugs, and downloads the project associated with the debug configuration selected in the drop-down box. Note that the icons are bound to that selected debug configuration. The function of each part of the Launch Bar is described below:

Icon 1: Builds the project associated with the debug configuration selected in drop-down box 5 — not the project selected in Project Explorer.
Icon 2: Runs/debugs the project associated with the selected debug configuration. This icon changes according to the content of drop-down box 4.
Icon 3: Exits download/debug mode.
Drop-down box 4: Switches between download/debug modes; switching changes what icon 2 displays.
Drop-down box 5: Selects the debug configuration file. This selection determines which projects icons 1, 2, and 3 act on.
Gear icon 6: Opens the currently selected debug configuration page, where you can modify and save it directly.
2.12.6. Running/Debugging Without the Launch Bar
For a newly created project, if you do not use the Launch Bar, right-click the project and select Debug As -> Debug Configurations. In the dialog, select the configuration corresponding to the project — for the helloworld project, select helloworld_debug_openocd — and then click Debug to start debugging.
Similarly, for the first run, right-click the project and select Run As -> Run Configurations. In the dialog, select the configuration corresponding to the project, and then click Run to start running.

If the current project has already been debugged or run as described above, use the drop-down option of  in the toolbar to quickly select the corresponding project configuration for debugging, or the drop-down option of
  to quickly select the corresponding configuration for running.
2.12.7. Viewing Registers in the Debug Perspective
After entering Debug mode, some views may not be visible right away; the Registers view is used as an example here. Select Window -> Show View -> Registers in the menu bar to open the Registers view, and use Ctrl-F in the view to search for registers. Similarly, to view memory, select Window -> Show View -> Memory; to open the debug console, select Window -> Show View -> Debugger Console. Other views are not covered here.
2.12.8. Terminating Processes in the Debug Perspective
To exit debugging in the Debug perspective, click  . To prevent errors caused by multiple open processes, right-click the process in the Debug view and select
 Terminate / Disconnect All to close all debug processes.
2.12.9. Functions of the Buttons in the Nuclei Studio Toolbar
The common Nuclei Studio toolbar icons are shown below. The function of each button is described below.

New button  : creates various files and projects.
Save the current file  , or save all unsaved files
  .
.
Switch build configuration  : only Debug and Release are available by default; you can add more configurations yourself.
Build project  : builds the project selected in Project Explorer using the drop-down options.
Build all projects  : builds all projects in Project Explorer at once.
New functionality  : creates projects, directories, files, and classes.
Debug  : selects a debug configuration from the drop-down options to debug the project.
Run  : selects a configuration from the drop-down options to run the project.
Profile  : the Profile feature is not currently supported and is not covered here.
User-defined tools  : not covered here; you can explore them on your own.
Search tools  : searches tasks, text, and more.
Text reading tools  : expands or collapses text, and so on.
Console tools  : opens various consoles or serial ports.
Debug buttons  : the first skips all breakpoints; the second performs the Restart function.
View CMSIS  : a built-in Eclipse feature; not currently supported.
Nuclei SDK project settings tool  : see Section 6.6.1.
Text reading tools  : sets quick navigation; the detailed functions are not covered here.
2.12.10. Showing Other Windows
The  button in the upper-right corner of the IDE switches between different display modes; the most commonly used are the C/C++ perspective and the Debug perspective. When entering Debug mode from another perspective, a dialog prompts you; click the
 Switch option to switch to the Debug perspective. Select Window -> Perspective -> Open Perspective in the menu bar to switch perspectives quickly.
The views available under Window -> Show View differ between perspectives. In the Debug perspective, you can show views such as Registers, Memory, and the Debugger Console.

2.12.11. Restoring the Default Window Layout
Select Window -> Perspective -> Reset Perspective in the menu bar and choose Reset Perspective in the dialog to restore the default window layout.
2.12.12. Comparing with File History
Right-click the file whose history you want to view and select Compare With -> Local History to open the history records. In the History view, double-click the file version you want to compare to view the file change history.

2.12.13. Possible Errors When Creating a Project
When a new project is created, the IDE indexes the entire project, and the time required varies with host performance. On a low-performance host, transient errors may appear during indexing; these errors disappear once indexing finishes. In this case, rely on the errors reported during the build.
2.12.14. Cached Paths When Adding an Include Path
When adding a path on the include page, cached path content may appear; in this case, click Workspace or File System and select the path to overwrite the cached content.
2.12.15. Cannot Find a Settings Page Section
Depending on the dialog size, some settings sections may be hidden; click the left/right arrow icons in the red box to show the hidden sections.

2.12.16. Slow Download Speed to the Development Board
If downloads to the development board are very slow, or timeout errors occur, switch to a USB 3.0 port. If you are developing in a virtual machine, set the USB interface to 3.0 as well.
2.12.17. Multiple Users Using Nuclei Studio on Linux
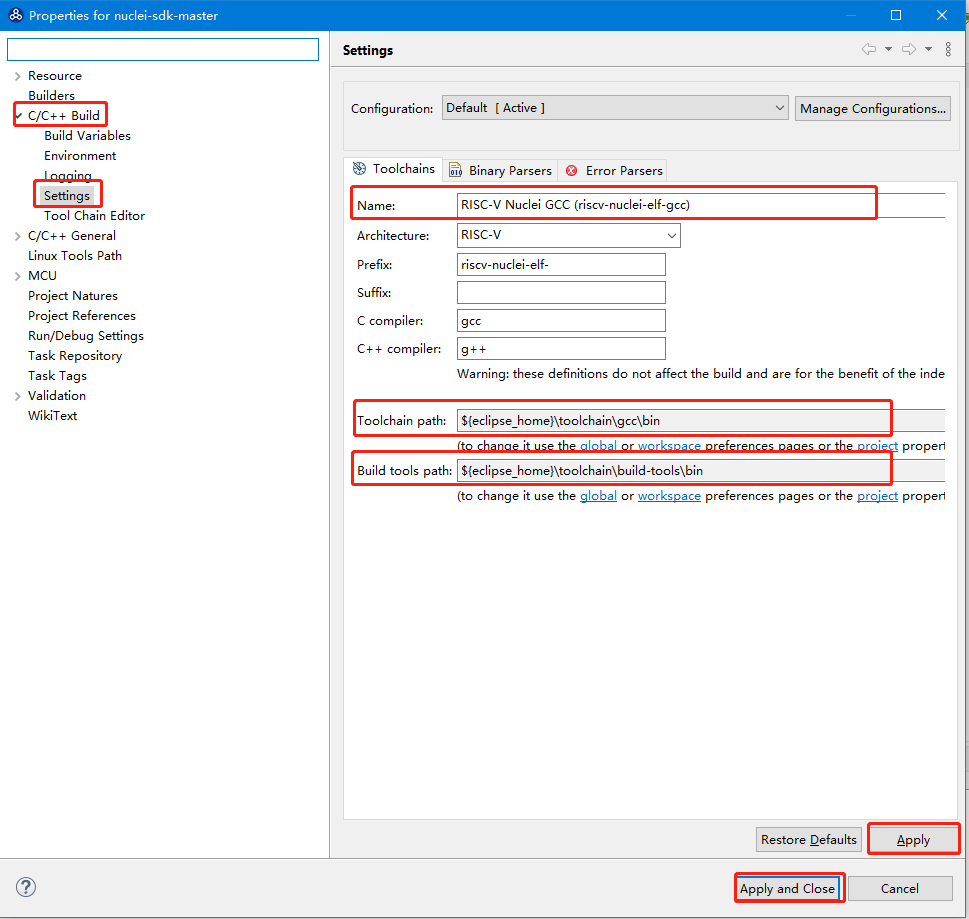
If multiple users need to use Nuclei Studio at the same time (not recommended), first open Window -> Preferences in the menu bar while running Nuclei Studio. Three settings must be modified in the dialog:
Open MCU -> Global OpenOCD Path, enter openocd for Executable, and enter ${eclipse_home}/toolchain/openocd/bin for Folder.
Open MCU -> Global QEMU Path, enter qemu-system-riscv32 for Executable, and enter ${eclipse_home}/tools/qemu for Folder.
Open MCU -> Global RISC-V Toolchains Paths, select RISC-V Nuclei GCC for Default toolchain, and enter ${eclipse_home}/toolchain/gcc/bin for Toolchain folder.
When finished, click Apply and Close to save the settings and close the dialog.
2.12.18. Two Serial Ports Recognized in Device Manager
After connecting the device, two serial ports may appear in Device Manager. The one with the larger COM number is used for serial output; you can connect to it with a tool such as a serial debugging assistant to view the print output. Do not open the serial port with the smaller COM number.

2.12.19. Error “Could Not Determine GDB Version After Sending: riscv-nuclei-elf-gdb –version, response:” on Linux
The first time you use Nuclei Studio on Linux, the error Could not determine GDB version after sending: riscv-nuclei-elf-gdb --version, response: may be reported.

riscv-nuclei-elf-gdb was renamed to riscv64-unknown-elf-gdb in Nuclei Studio 2023.10 and later.
Use the command ldd $(which riscv-nuclei-elf-gdb) to check for missing dependencies.

After installing the required dependencies with the command sudo apt install libncursesw5 libtinfo5, the IDE runs normally. For details, see https://github.com/riscv-mcu/riscv-gnu-toolchain/issues/9
2.12.20. Error Reported When Using QEMU on Linux
For example, when using QEMU on Ubuntu 20.04, the following error may be reported:
error while loading shared libraries: libfdt.so.1: cannot open shared object file: No such file or directory
This is caused by missing dependencies such as libfdt.so. Install the corresponding dependencies for your version of Linux. For example, on Ubuntu 20.04, use the following command:
Install libfdt and other dependencies: sudo apt install libfdt1 libpixman-1-0 libpng16-16 libasound2 libglib2.0-0
2.12.21. Error About Missing Symbols When Linking the C Library During Project Build
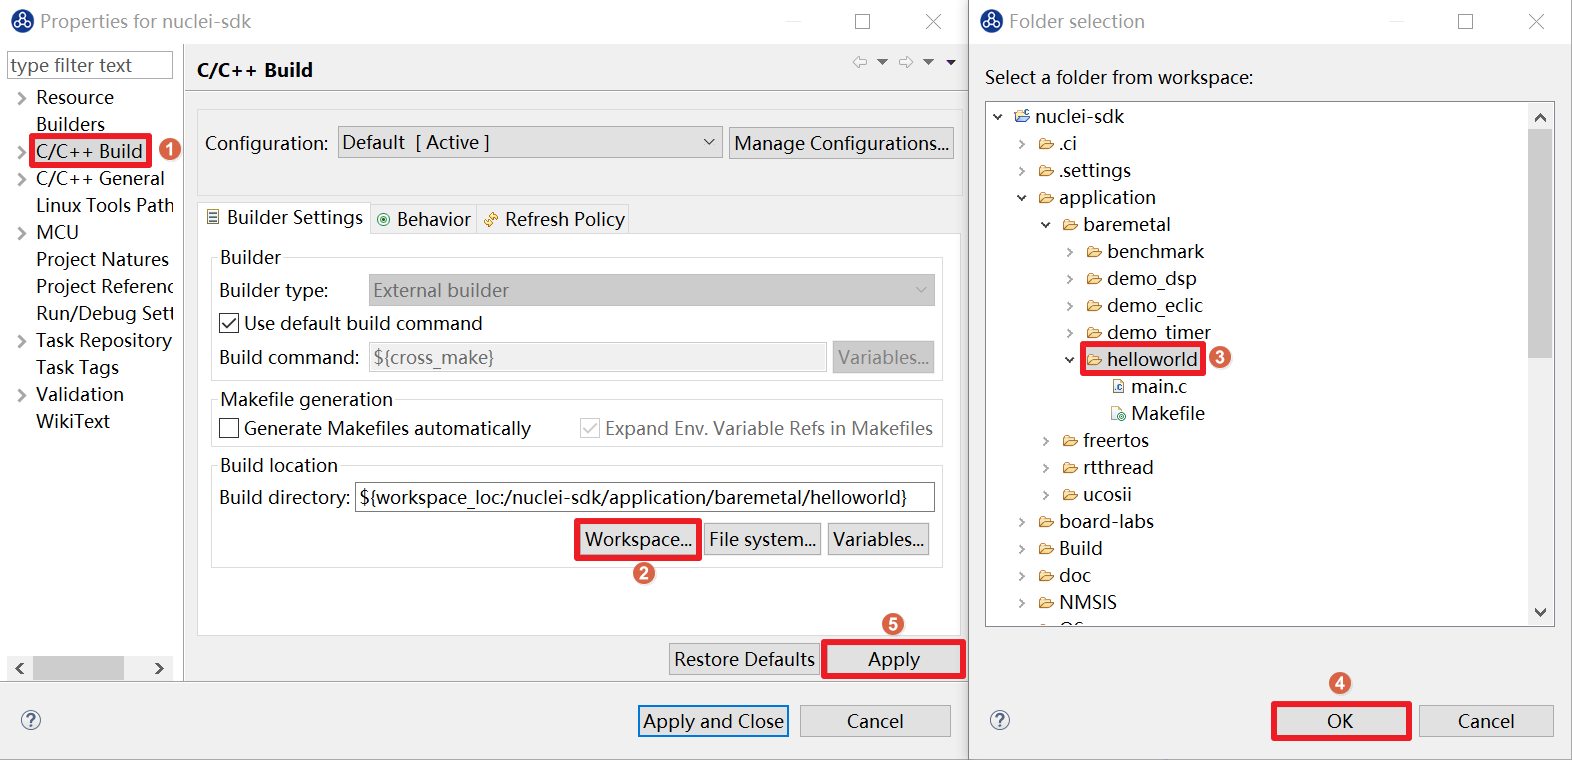
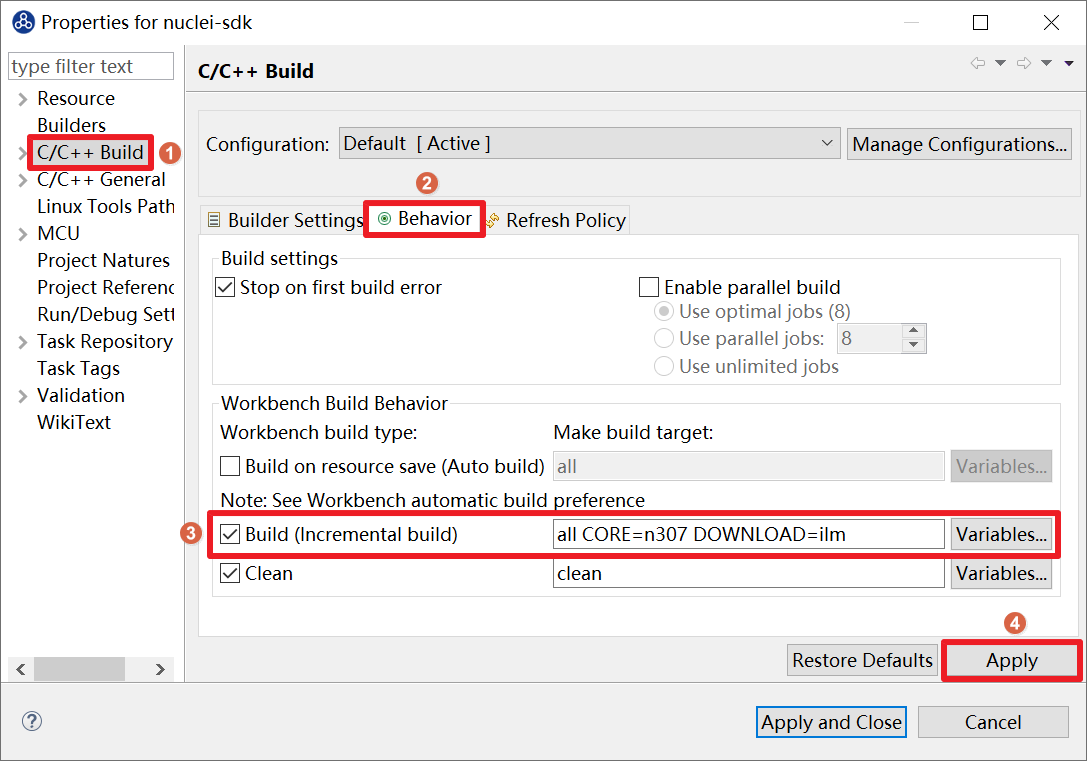
In Nuclei Studio 2024.06, this problem is resolved: simply check Group Libraries on the Linker -> Libraries page.

Because the handling of Libraries does not properly resolve the inter-dependencies between linked libraries, the build may fail when the libraries in use depend on each other. For details, see https://github.com/eclipse-embed-cdt/eclipse-plugins/issues/592. There are two ways to solve this problem.

Either adjust the order of the Libraries, or add the same libraries multiple times.

Open C/C++ Build -> Settings -> Tool Settings -> GNU RISC-V Cross C++ Linker and modify the Command line pattern as follows:
${COMMAND}
${cross_toolchain_flags} ${FLAGS} ${OUTPUT_FLAG}
${OUTPUT_PREFIX}${OUTPUT} ${OBJS}${USER_OBJS} -Wl,--start-group
$(LIBS)
-Wl,--end-group
The IDE then processes the contents of Libraries as a group.


2.12.22. Build Error: Fatal Error: rvintrin.h: No Such File or Directory
In Nuclei Studio 2023.10, if a project created with an old SDK reports fatal error: rvintrin.h: No such file or directory when built, it is because the project uses #include <rvintrin.h>, which is required in GCC 10 but no longer needed in GCC 13. Simply delete this line and the build will pass.

2.12.23. Debug Error: Error: Couldn’t Find an Available Hardware Trigger
In the Nuclei Studio environment, when a project runs on CPU hardware without hardware breakpoints and the program is downloaded to Flash to run (for Nuclei SDK/Nuclei N100 SDK, this is the flash/flashxip DOWNLOAD mode), the program may fail to stop during debugging with the error message: Error: Couldn't find an available hardware trigger. This is because the program runs in Flash, where software breakpoints cannot be written successfully, and the CPU has no hardware breakpoints available.

In this case, build the program to RAM so that the IDE can debug it (software breakpoints); to debug it in Flash, use the command line for now.
2.12.24. Viewing the GDB Trace While Debugging a Project
In the Nuclei Studio environment, the GDB Trace feature records in detail the GDB commands used while debugging a program. This feature is disabled by default; enable it if you need to view the GDB Trace. In the Nuclei Studio menu, click Window -> Preferences; in the Preferences window that opens, select C/C++ -> Debug -> GDB, find the Show the GDB traces consoles with character limit option, and check it.
During debugging, click Display Selected Console in the Console window to switch to the GDB Trace console, where you can view the GDB Trace to help analyze problems encountered during debugging.
2.12.25. Connecting to a Running Target While Debugging a Project
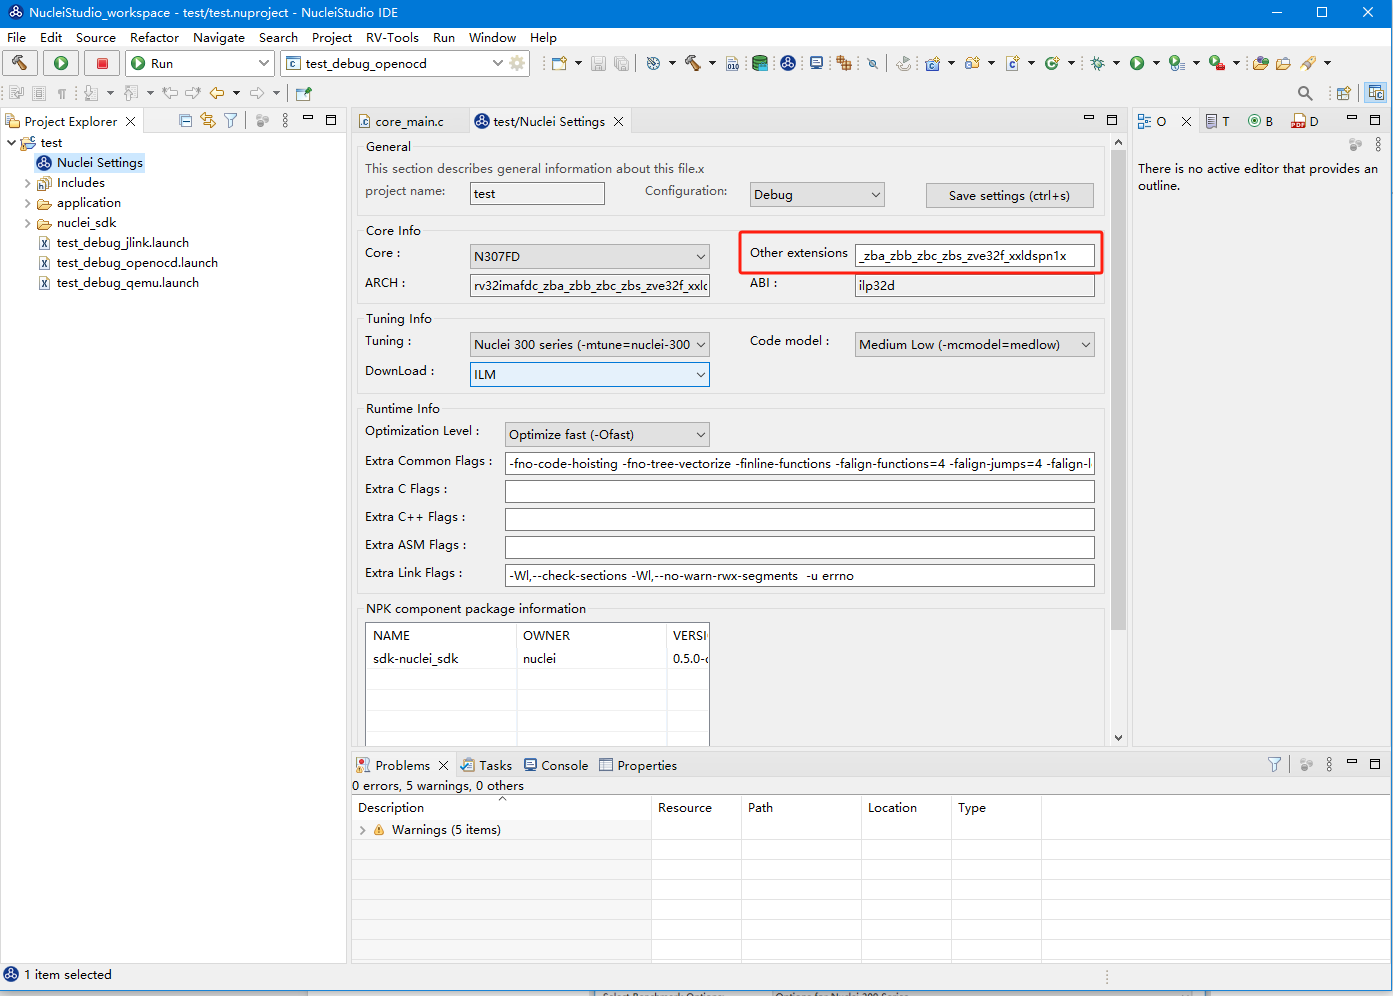
When using OpenOCD to debug a project in the Nuclei Studio environment, connect to a running target as follows. Open the Debug_openocd configuration file, select the Startup tab, and modify the configuration as shown below:
Uncheck Init reset to avoid sending commands such as monitor reset that would reset the CPU;
Uncheck Load executable to avoid downloading the ELF again;
Uncheck Pre-run/restart commands to avoid sending commands such as monitor reset that would reset the CPU;
Uncheck Continue, so that once OpenOCD is connected, it enters the debug state directly with execution paused.
Click the Debug button; you can see that it is now connected to the running target.

When using J-Link to debug a project, connect to a running target as follows. Open the Debug_jlink configuration file, select the Debugger tab, modify the configuration as shown below, and click the Debug button; you can see that it is now connected to the running target.

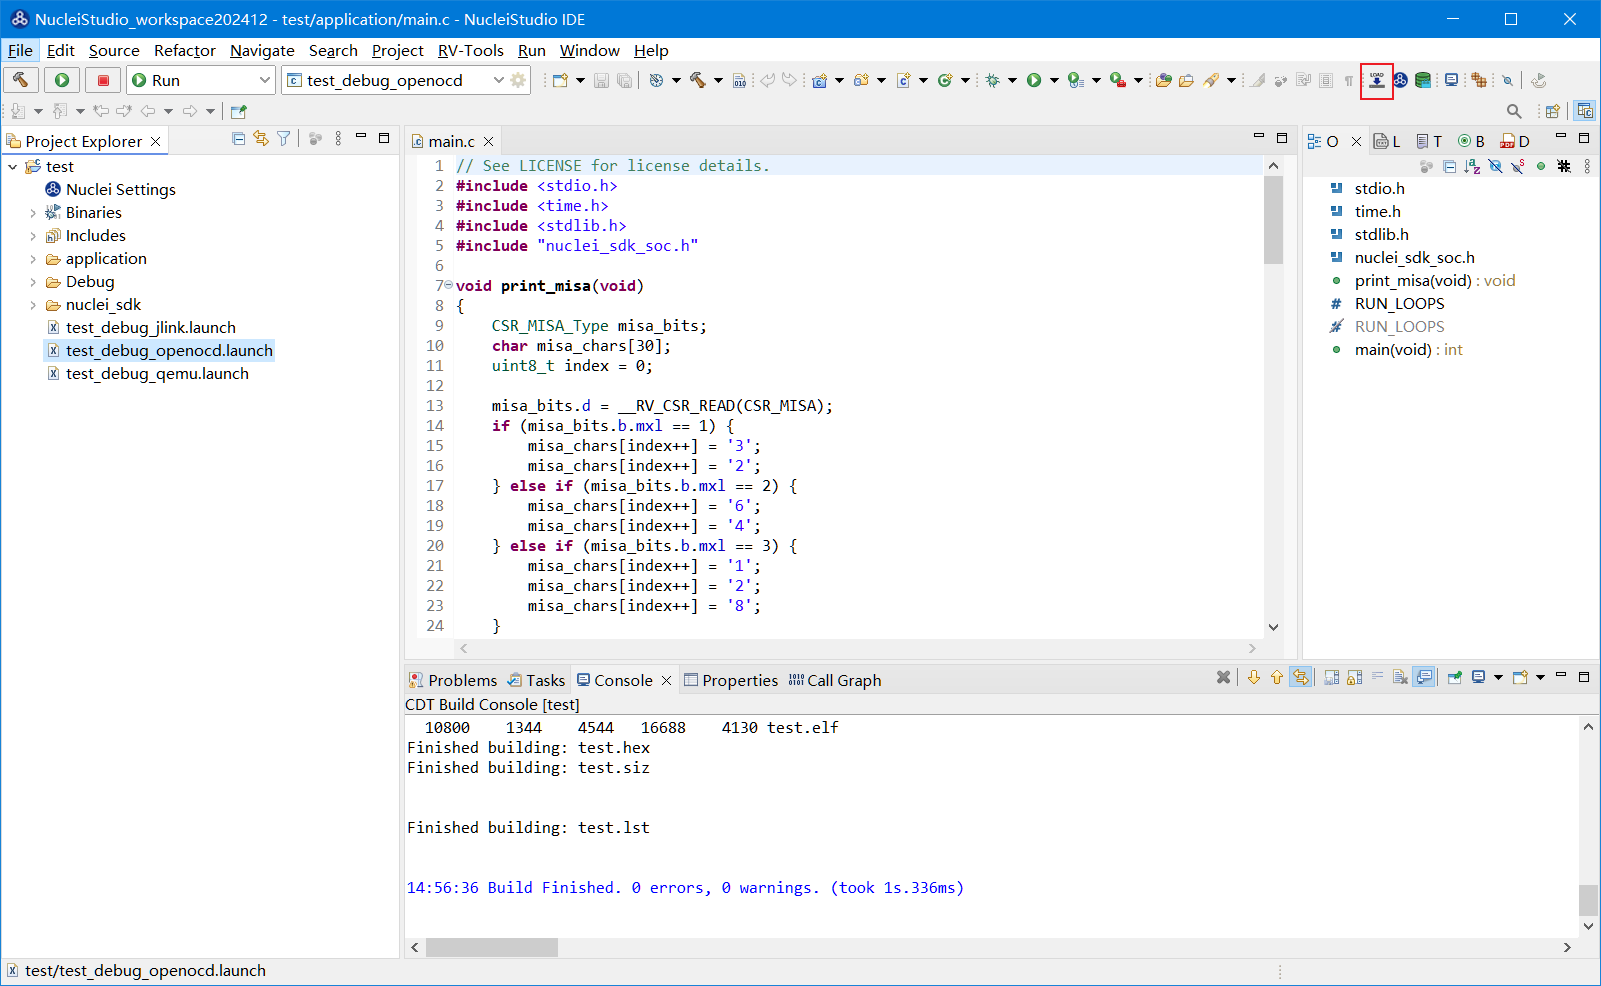
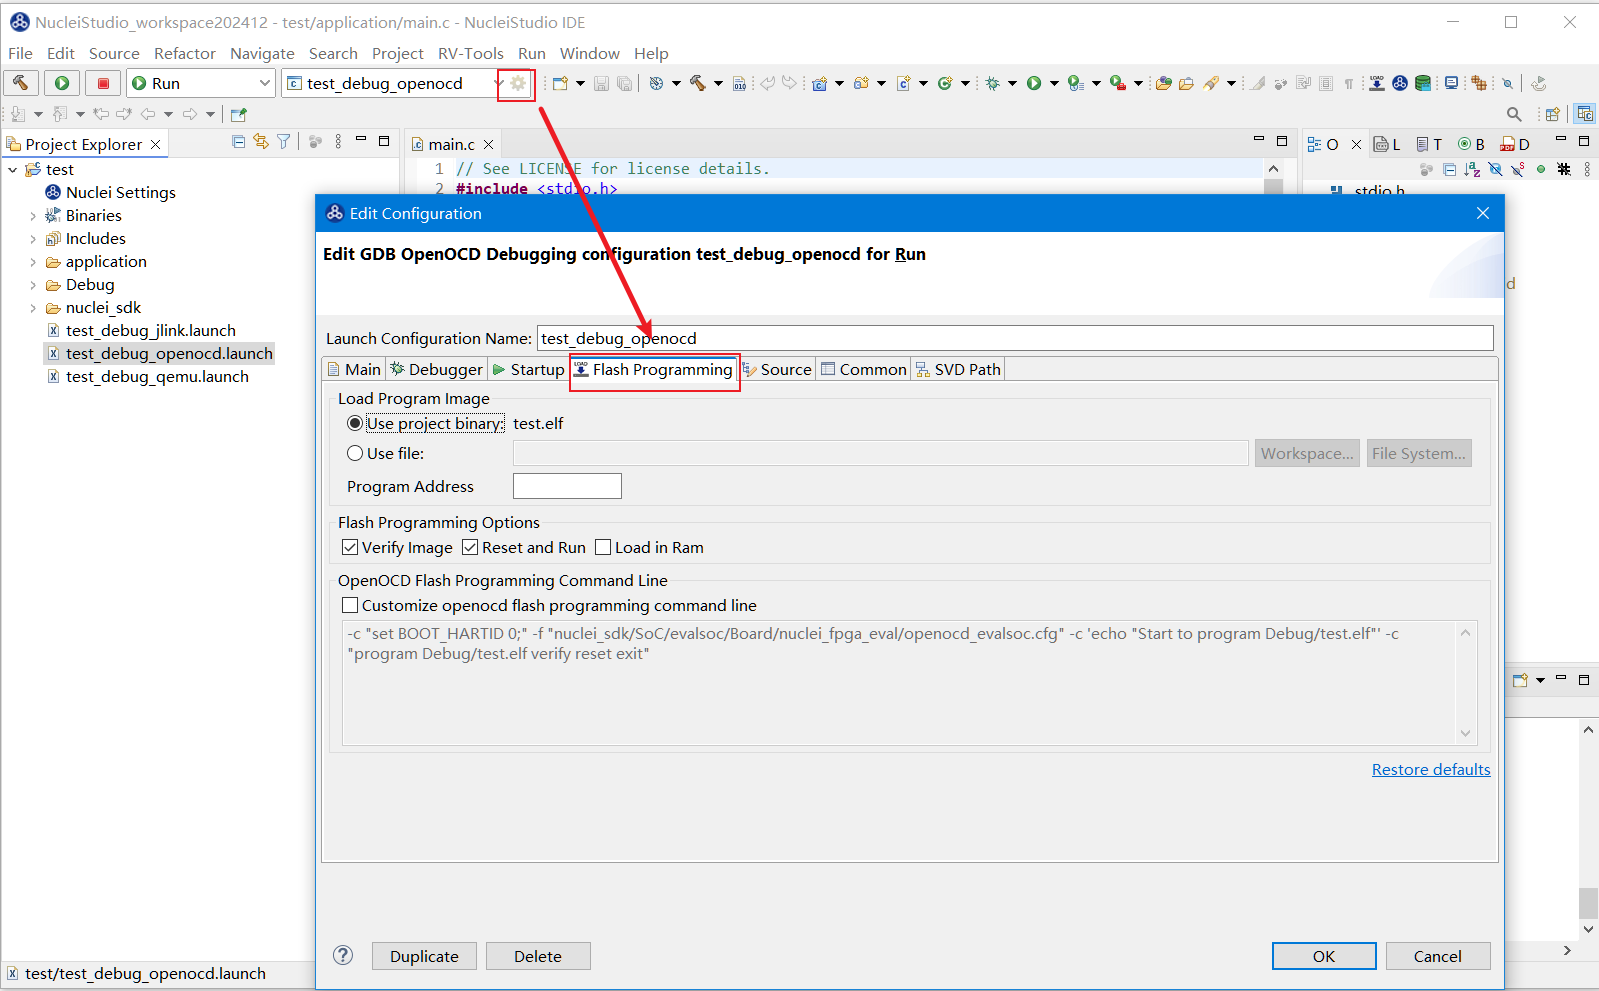
2.12.26. Known Defects in Flash Programming
When using the Flash Programming feature, selecting the file to load through File System triggers a code defect that makes the command incomplete. To avoid this problem, place the file to be loaded under the project directory.

Flash Programming depends on OpenOCD. If you use Flash Programming in Nuclei Studio with a configuration that does not launch OpenOCD, Nuclei Studio freezes. If this happens, check whether the configuration is correct.

2.12.27. Hardware Check Before Debugging a Project in Nuclei Studio
Before using the Nuclei Studio IDE for software development and debugging, make sure the target hardware (such as an FPGA-based RISC-V system) is correctly configured and running stably. Use the following steps to verify whether the hardware platform is ready for normal software debugging.
2.12.27.1. Checking Whether the OpenOCD Configuration File openocd.cfg Is Correct
OpenOCD is an important tool for JTAG debugging with the RISC-V core on the FPGA. Starting a debug session requires a correct .cfg configuration file. Use the following steps to confirm whether the openocd.cfg file is correct.
- Use the OpenOCD tool under the Nuclei Studio installation directory:
Windows: NucleiStudio/toolchain/openocd/bin/openocd.exe
Linux: NucleiStudio/toolchain/openocd/bin/openocd
Copy the configuration file (such as openocd_demosoc.cfg) to the bin directory of OpenOCD.
Run the command to start OpenOCD:
openocd -f openocd.cfg
If OpenOCD starts successfully and displays connection information, the JTAG interface and CPU on the FPGA board are working properly.
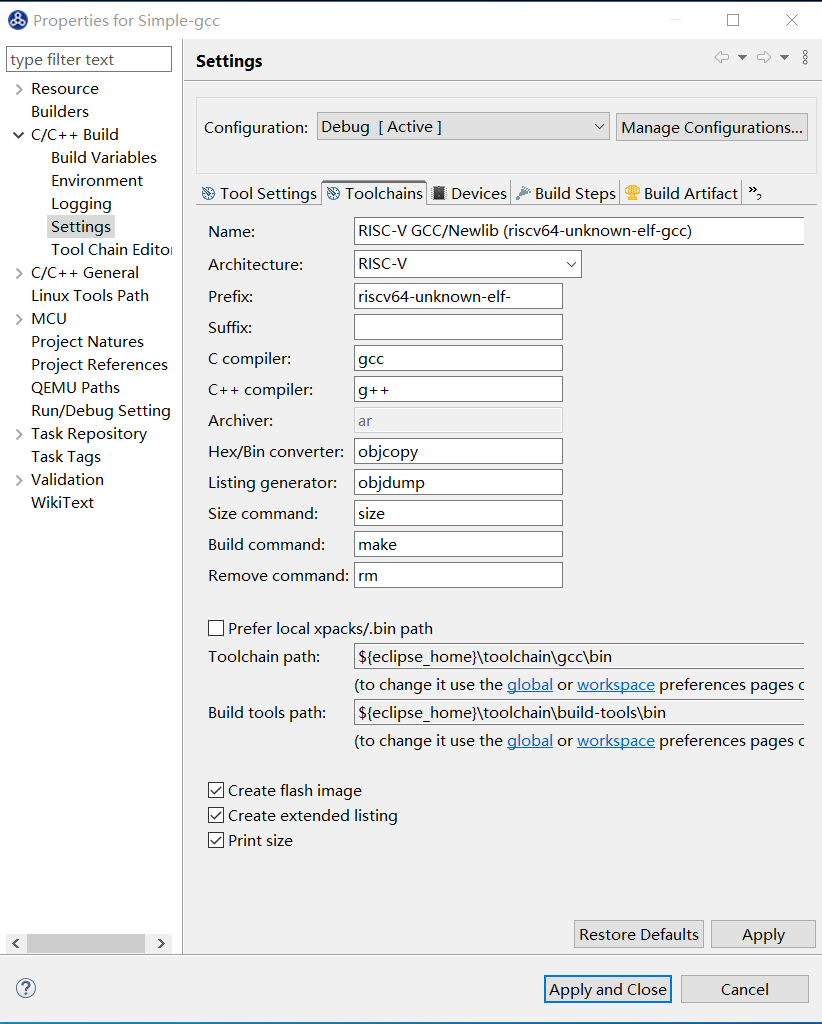
Notes:
If there is no SPI Flash on the FPGA, or Flash programming is not needed, you can delete the Flash-related configuration items in the .cfg file.
Make sure the JTAG pins, CPU type, frequency, and other parameters in the configuration file match your hardware.
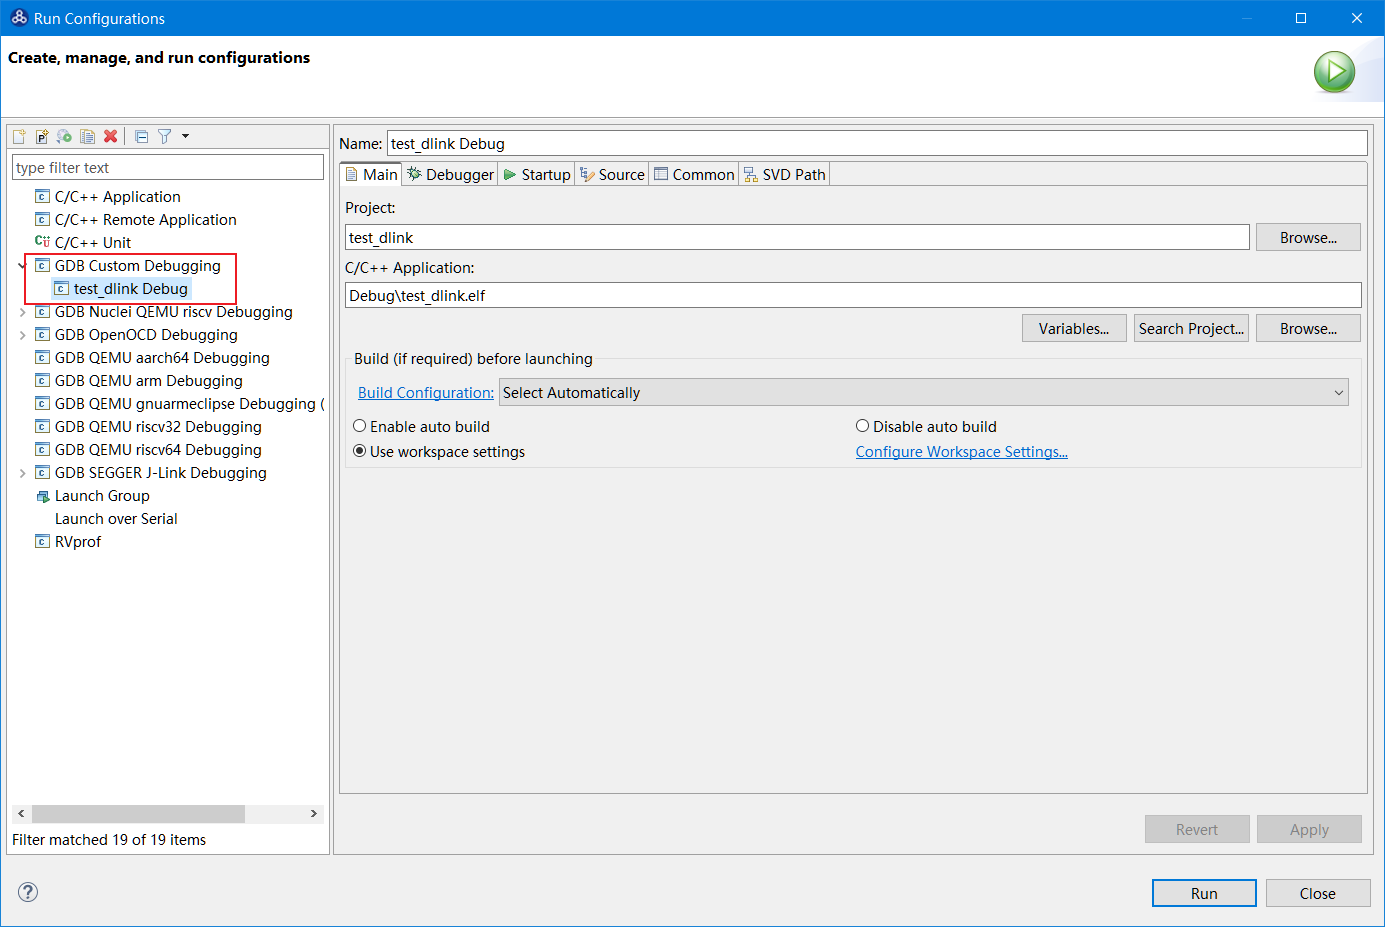
2.12.27.2. Using the Command Line to Confirm GDB and OpenOCD Can Communicate Properly
To further verify the hardware status, use the GDB command-line tool to establish a connection with OpenOCD.
Start OpenOCD (see the previous step)
Open a new terminal and go to the GDB tool path:
Windows: NucleiStudio/toolchain/gcc/bin/riscv-nuclei-elf-gdb.exe
Linux: NucleiStudio/toolchain/gcc/bin/riscv-nuclei-elf-gdb
Start GDB and execute the following commands:
(gdb) set arch riscv:rv32     # or rv64, depending on the CPU architecture
(gdb) set remotetimeout 240   # set the remote connection timeout
(gdb) target remote :3333     # connect to the default OpenOCD port
If the connection succeeds, the JTAG interface and the RISC-V core on the FPGA are running normally.

Possible issues:
The CPU frequency on the FPGA is low → the first connection may time out; it is recommended to set set remotetimeout 240 in advance. For details, see Nuclei Studio cannot debug due to a low CPU frequency.
2.12.27.3. Using GDB Commands to Check Low-Level Hardware Functions
Once GDB is successfully connected, you can verify the functions of the CPU, SRAM, and peripheral registers through a series of commands.

Test items and commands:
Read and write general-purpose registers (GPRs)
(gdb) p/x $pc        # view the current PC value
(gdb) p/x $a0        # view the a0 register value
Read and write CSR registers
(gdb) info reg $mstatus    # view the mstatus register
(gdb) info reg $misa       # view the supported instruction set architecture
Read and write SRAM memory (verify memory stability)
Prepare a test bin file and load it into SRAM:
(gdb) restore test.bin binary 0x80000000
Dump it from memory and compare:
(gdb) dump binary memory dump.bin 0x80000000 0x80001000
Check whether test.bin and dump.bin are exactly identical.
If the data is inconsistent, the SRAM may have timing or interface problems.
8-bit/16-bit data access test
Verify whether byte-level access is supported:
(gdb) x/1bx 0x80000000      # read a single byte
(gdb) x/1hx 0x80000000      # read a halfword (16-bit)
Read and write SoC peripheral registers
Perform read/write tests on registers mapped in the peripheral address space:
(gdb) p/x *(int *)0x10000000   # read a peripheral register
(gdb) set *(int *)0x10000000 = 0x1  # write a value

2.12.28. Nuclei Studio Cannot Debug Due to a Low CPU Frequency
If the CPU frequency is low, Nuclei Studio debugging may fail or become unstable. In this case, it is recommended to lower the JTAG frequency in the OpenOCD configuration file; it should generally be less than half of the CPU frequency, and about one quarter of the CPU frequency is recommended. When using Nuclei Studio, also increase the timeout value in the set remotetimeout 250 command (in seconds) to improve the connection success rate.

2.12.29. Setting the Nuclei Studio Theme Colors
Nuclei Studio is built on Eclipse, and its theme colors have not been modified, so it inherits Eclipse’s theme color functionality. To change the theme colors of Nuclei Studio, refer to the methods for changing Eclipse theme colors. You can also quickly configure a general theme through the preferences.

2.12.30. No Project Creation Menu in the Debug Perspective
Nuclei Studio 2025.10 updated the menu display logic so that common menus can be shown in the Debug perspective. If your current version is Nuclei Studio 2025.10 or later and the New Nuclei RISC-V C/C++ Project menu is missing under File -> New in the Debug perspective, restart the Debug perspective to refresh the menus.
Close the Debug perspective from its upper-right corner.

Then reopen the Debug perspective.

The newly added New Nuclei RISC-V C/C++ Project menu then appears under File -> New. Menus commonly used during debugging, such as Trace and Live Watch, also appear under Window -> Show View.

2.12.31. Build Error: DWARF Error: Mangled Line Number Section (Bad File Number)
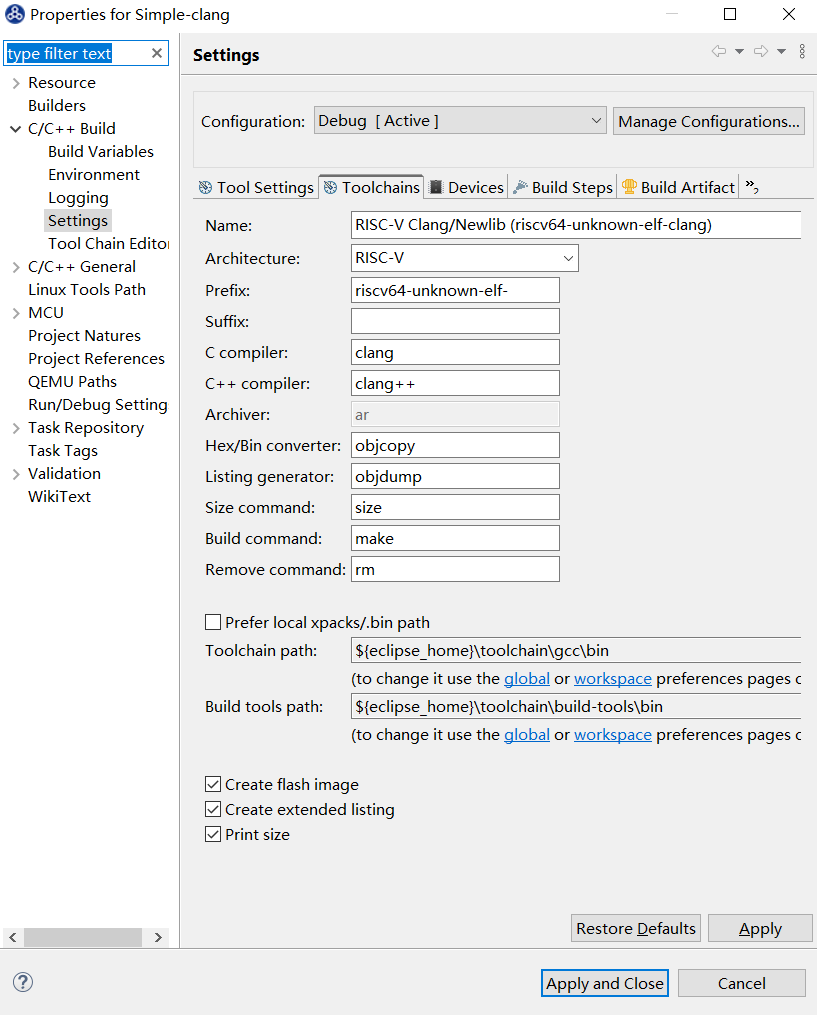
When building a project with Clang in Nuclei Studio, the warning DWARF error: mangled line number section (bad file number) may appear. This is usually because Nuclei Studio uses the objdump from the GCC toolchain to process the ELF file generated by Clang, and compatibility differences trigger this warning. This problem generally does not affect the normal build and execution of the program.
2.12.32. How to Build a Project That Supports Semihosting
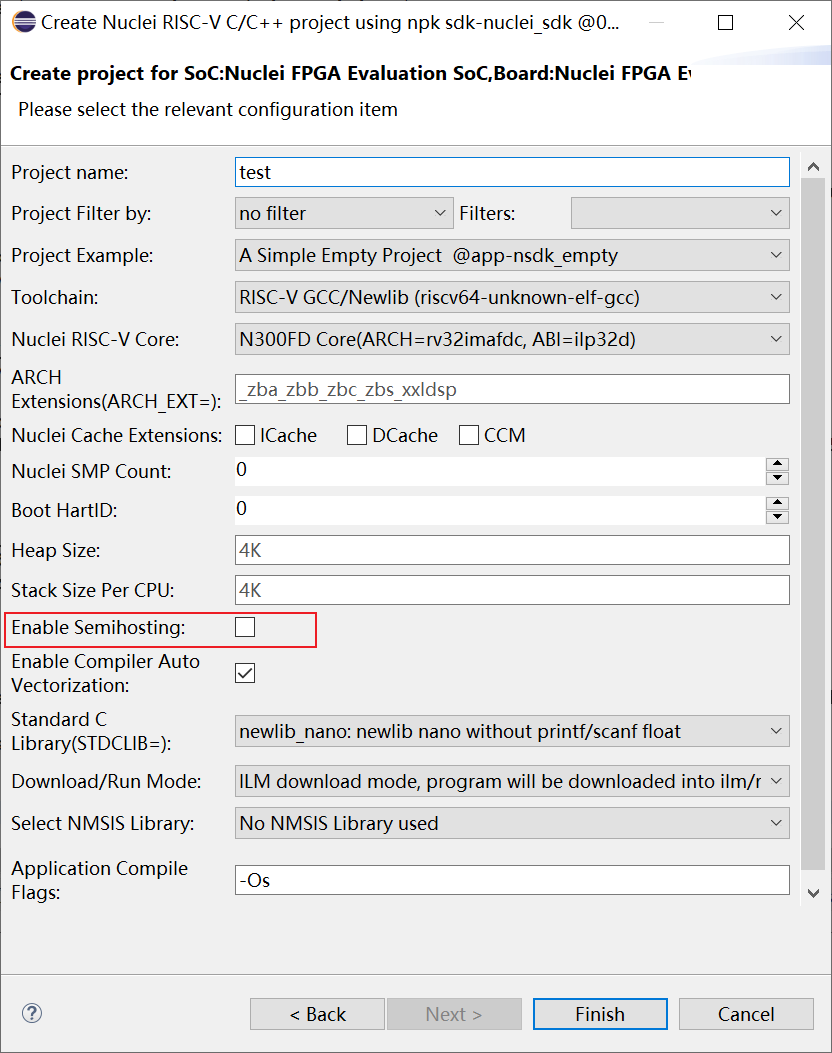
When creating a project with Nuclei SDK, check Enable Semihosting to generate a project that supports Semihosting directly.
For projects that have already been created, or projects not created with Nuclei SDK, enable Semihosting manually with the following steps.
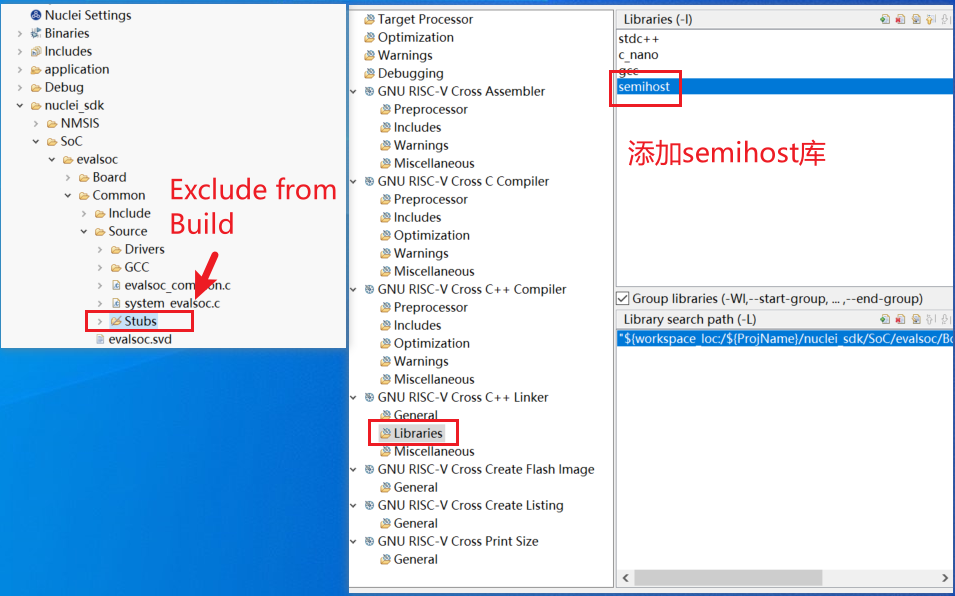
This kind of project usually implements basic I/O through Stubs functions. When enabling Semihosting, you must replace the original Stubs implementation with the implementation provided by the semihost library.
First, exclude the original Stubs code. Taking a project created with Nuclei SDK as an example, select SoC\evalsoc\Common\Source\Stubs, then right-click and choose Resource Configurations -> Exclude from Build... to exclude this code from the build. When Semihosting is no longer needed, re-include it in the same way to switch back quickly.
The figure below takes newlib as an example: when linking, the semihost library must be used. If you use libncrt, replace fileops_uart with fileops_semi. If you use the zcc toolchain, the semihost library must also be added during the link stage.
2.12.33. How to Debug a Semihosting-Enabled Project with J-Link
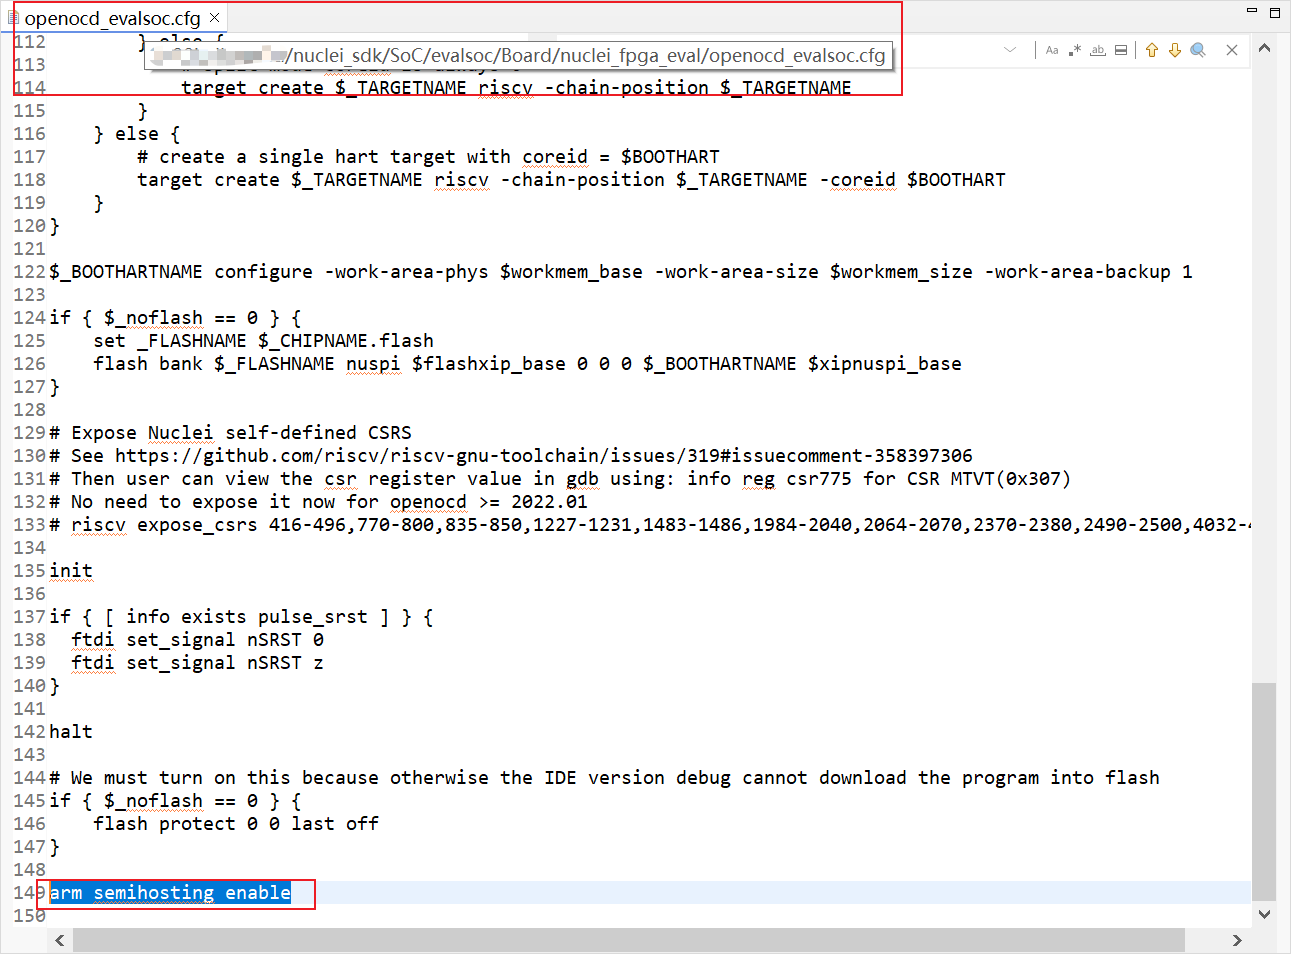
The IDE debugs with J-Link through the J-Link GDB Server by default, but this method does not support Semihosting. To enable Semihosting while using J-Link as the debugger, refer to the following two solutions:
Use J-Link’s native Semihosting functionality. This solution must be used together with Ozone; for details, see SEGGER’s Ozone offers enhanced debugging with RISC-V Semihosting.
Use OpenOCD + J-Link for debugging; see Using J-Link with OpenOCD. This solution only supports the JTAG interface and does not support cJTAG.
For the OpenOCD + J-Link solution, use JLinkConfig or Zadig to switch the J-Link USB driver to WinUSB, then enable Semihosting in the OpenOCD configuration file. The following configuration can be used as a reference:
adapter_khz 1000
# The below 2 lines configure openocd to work with jlink
interface jlink
transport select jtag
#reset_config trst_only
set _CHIPNAME riscv
jtag newtap $_CHIPNAME cpu -irlen 5
set _TARGETNAME $_CHIPNAME.cpu
target create $_TARGETNAME riscv -chain-position $_TARGETNAME
$_TARGETNAME configure -work-area-phys 0x80000000 -work-area-size 10000 -work-area-backup 1
set _FLASHNAME $_CHIPNAME.flash
flash bank $_FLASHNAME fespi 0x20000000 0 0 0 $_TARGETNAME
# Set the ILM space also as flash, to make sure it can be add breakpoint with hardware trigger
#flash bank onboard_ilm fespi 0x80000000 0 0 0 $_TARGETNAME
# Expose Nuclei self-defined CSRS
# See https://github.com/riscv/riscv-gnu-toolchain/issues/319#issuecomment-358397306
# Then user can view the csr register value in gdb using: info reg csr775 for CSR MTVT(0x307)
# riscv expose_csrs 416-496,770-800,835-850,1227-1231,1483-1486,1984-2040,2064-2070,2370-2380,2490-2500,4032-4040
init
if {[ info exists pulse_srst]} {
  ftdi_set_signal nSRST 0
  ftdi_set_signal nSRST z
}
halt
# We must turn on this because otherwise the IDE version debug cannot download the program into flash
flash protect 0 0 last off
arm semihosting enable
2.12.34. Debug Session Hangs Due to Address Preloading in the Memory Window
Problem description
When using the Memory window in the IDE to view memory, the interface freezes and the debug session becomes unresponsive. A typical scenario: when viewing the address 0xf0030000, the IDE automatically preloads data from adjacent addresses and touches an unmapped region (such as 0xf002xxxx), causing the target to return an access error.
Root cause
The Automatic rendering mode of the Memory window preloads data outside the visible area to optimize the scrolling experience. When the preloaded addresses fall into:
unmapped memory regions
reserved regions protected by the MPU
peripheral address holes
the target hardware returns a Bus Fault or access error, and GDB enters a waiting/error state, which appears as the IDE freezing.
Solution
Recommended: switch to Manual mode
Right-click in the Memory window → Table Renderings Preferences…
Select Manual for Memory loading mode
Click OK
2.13. Other Issues Without a Noted Version
If there are any omissions in this document, refer to https://www.rvmcu.com/nucleistudio-faq.html. Common problems encountered in later versions are listed there.